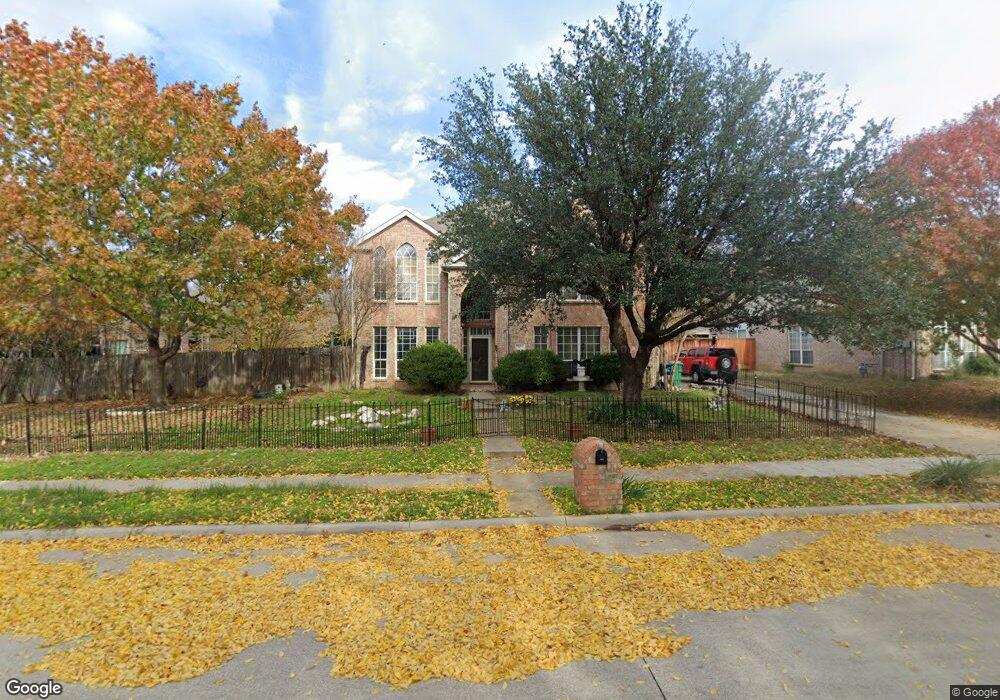
905 Abbots Ln Denton, TX 76205
South Denton NeighborhoodEstimated Value: $489,734 - $531,000
4
Beds
3
Baths
3,006
Sq Ft
$168/Sq Ft
Est. Value
About This Home
This home is located at 905 Abbots Ln, Denton, TX 76205 and is currently estimated at $504,684, approximately $167 per square foot. 905 Abbots Ln is a home located in Denton County with nearby schools including Houston Elementary School, McMath Middle School, and Denton High School.
Ownership History
Date
Name
Owned For
Owner Type
Purchase Details
Closed on
Aug 8, 2011
Sold by
Gregard Hans C and Gregard Eira
Bought by
Amyx Monica Hurtado
Current Estimated Value
Home Financials for this Owner
Home Financials are based on the most recent Mortgage that was taken out on this home.
Original Mortgage
$198,550
Outstanding Balance
$137,217
Interest Rate
4.53%
Mortgage Type
New Conventional
Estimated Equity
$367,467
Purchase Details
Closed on
Feb 26, 2002
Sold by
Groves Joel C and Groves Laura K
Bought by
Gregard Hans C and Gregard Eira
Home Financials for this Owner
Home Financials are based on the most recent Mortgage that was taken out on this home.
Original Mortgage
$142,400
Interest Rate
6.81%
Purchase Details
Closed on
Aug 31, 1998
Sold by
Pulte Homes Of Texas Lp
Bought by
Groves Joel C and Groves Laura K
Home Financials for this Owner
Home Financials are based on the most recent Mortgage that was taken out on this home.
Original Mortgage
$135,600
Interest Rate
6.94%
Create a Home Valuation Report for This Property
The Home Valuation Report is an in-depth analysis detailing your home's value as well as a comparison with similar homes in the area
Home Values in the Area
Average Home Value in this Area
Purchase History
| Date | Buyer | Sale Price | Title Company |
|---|---|---|---|
| Amyx Monica Hurtado | -- | Rtt | |
| Gregard Hans C | -- | -- | |
| Groves Joel C | -- | -- |
Source: Public Records
Mortgage History
| Date | Status | Borrower | Loan Amount |
|---|---|---|---|
| Open | Amyx Monica Hurtado | $198,550 | |
| Previous Owner | Gregard Hans C | $142,400 | |
| Previous Owner | Groves Joel C | $135,600 | |
| Closed | Groves Joel C | $25,431 | |
| Closed | Gregard Hans C | $17,800 |
Source: Public Records
Tax History
| Year | Tax Paid | Tax Assessment Tax Assessment Total Assessment is a certain percentage of the fair market value that is determined by local assessors to be the total taxable value of land and additions on the property. | Land | Improvement |
|---|---|---|---|---|
| 2025 | $7,921 | $505,410 | $100,060 | $405,350 |
| 2024 | $9,116 | $472,307 | $0 | $0 |
| 2023 | $7,001 | $429,370 | $88,288 | $421,078 |
| 2022 | $8,286 | $390,336 | $88,288 | $307,464 |
| 2021 | $7,888 | $361,374 | $88,288 | $273,086 |
| 2020 | $7,374 | $322,592 | $88,288 | $234,304 |
| 2019 | $7,391 | $309,760 | $88,288 | $225,487 |
| 2018 | $6,803 | $281,600 | $69,767 | $249,206 |
| 2017 | $6,328 | $256,000 | $55,814 | $200,186 |
| 2016 | $5,767 | $243,265 | $55,814 | $187,451 |
| 2015 | $5,486 | $238,000 | $47,882 | $190,118 |
| 2013 | -- | $208,980 | $47,882 | $161,098 |
Source: Public Records
Map
Nearby Homes
- 1212 Pennsylvania Dr
- 833 Sandpiper Dr
- 821 Sandpiper Dr
- 905 Lynhurst Ln
- 1108 Ellison Park Cir
- 709 Pennsylvania Dr
- 724 Smokerise Cir
- 2205 Jefferson Trail
- 900 Ellison Park Cir
- 600 Ticonderoga Dr
- 3100 Masthead Dr
- Tbd El Cielito St
- 1501 Lynhurst Ln
- 3109 Forrestridge Dr
- 924 Ridgecrest Cir
- 2009 Lake Fork Ct
- 3321 Monte Carlo Ln
- 2218 Southridge Dr
- 2209 Loon Lake Rd
- 2016 Pembrooke Place
- 913 Abbots Ln
- 908 Providence St
- 904 Providence St
- 900 Providence St
- 912 Providence St
- 908 Abbots Ln
- 904 Abbots Ln
- 912 Abbots Ln
- 917 Abbots Ln
- 900 Abbots Ln
- 916 Providence St
- 916 Abbots Ln
- 921 Abbots Ln
- 909 Providence St
- 836 Abbots Ln
- 829 Abbots Ln
- 905 Providence St
- 920 Providence St
- 913 Providence St
- 920 Abbots Ln
Your Personal Tour Guide
Ask me questions while you tour the home.