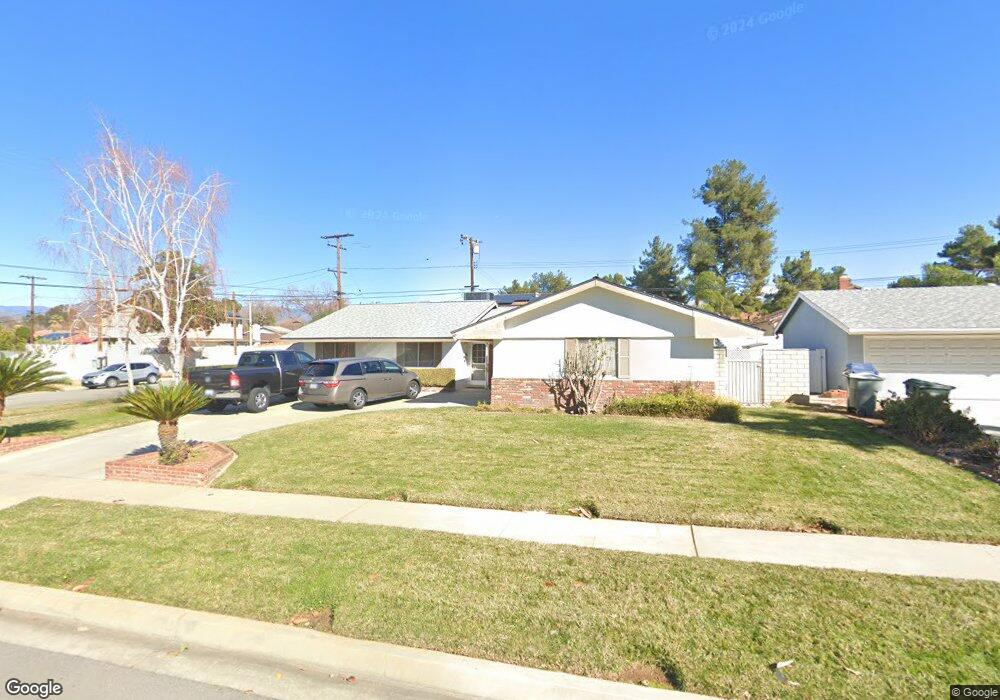
905 Bermuda Dr Redlands, CA 92374
South Redlands NeighborhoodEstimated Value: $600,996 - $650,000
3
Beds
2
Baths
1,405
Sq Ft
$450/Sq Ft
Est. Value
About This Home
This home is located at 905 Bermuda Dr, Redlands, CA 92374 and is currently estimated at $632,249, approximately $449 per square foot. 905 Bermuda Dr is a home located in San Bernardino County with nearby schools including Kimberly Elementary School, Moore Middle School, and Redlands Senior High School.
Ownership History
Date
Name
Owned For
Owner Type
Purchase Details
Closed on
Feb 25, 2019
Sold by
Reeves Howard Dewayne and Reeves Colleen Ann
Bought by
Reeves Howard D and Reeves Colleen A
Current Estimated Value
Purchase Details
Closed on
Aug 19, 2005
Sold by
Kwappenberg Colleen A
Bought by
Kwappenberg Colleen A
Home Financials for this Owner
Home Financials are based on the most recent Mortgage that was taken out on this home.
Original Mortgage
$20,000
Interest Rate
5.64%
Mortgage Type
Credit Line Revolving
Purchase Details
Closed on
Sep 27, 2002
Sold by
Kwappenberg Kiel J
Bought by
Kwappenberg Colleen A
Create a Home Valuation Report for This Property
The Home Valuation Report is an in-depth analysis detailing your home's value as well as a comparison with similar homes in the area
Home Values in the Area
Average Home Value in this Area
Purchase History
We collect this data history from publicly available records. To have your information removed, we recommend requesting removal directly through your county’s website.
| Date | Buyer | Sale Price | Title Company |
|---|---|---|---|
| Reeves Howard D | -- | None Available | |
| Kwappenberg Colleen A | -- | Cal Hall-Placer | |
| Kwappenberg Colleen A | -- | -- |
Source: Public Records
Mortgage History
We collect this data history from publicly available records. To have your information removed, we recommend requesting removal directly through your county’s website.
| Date | Status | Borrower | Loan Amount |
|---|---|---|---|
| Closed | Kwappenberg Colleen A | $20,000 |
Source: Public Records
Tax History
| Year | Tax Paid | Tax Assessment Tax Assessment Total Assessment is a certain percentage of the fair market value that is determined by local assessors to be the total taxable value of land and additions on the property. | Land | Improvement |
|---|---|---|---|---|
| 2025 | $2,419 | $199,309 | $43,674 | $155,635 |
| 2024 | $2,259 | $195,401 | $42,818 | $152,583 |
| 2023 | $2,255 | $191,569 | $41,978 | $149,591 |
| 2022 | $2,221 | $187,813 | $41,155 | $146,658 |
| 2021 | $2,259 | $184,130 | $40,348 | $143,782 |
| 2020 | $2,225 | $182,242 | $39,934 | $142,308 |
| 2019 | $2,162 | $178,669 | $39,151 | $139,518 |
| 2018 | $2,107 | $175,165 | $38,383 | $136,782 |
| 2017 | $2,087 | $171,730 | $37,630 | $134,100 |
| 2016 | $2,062 | $168,363 | $36,892 | $131,471 |
| 2015 | $2,046 | $165,834 | $36,338 | $129,496 |
| 2014 | $2,008 | $162,585 | $35,626 | $126,959 |
Source: Public Records
Map
Nearby Homes
- 1049 Evergreen Ct
- 1032 Ardmore Cir
- 1200 E Highland Ave Unit 406
- 855 S Grove St
- 233 Phlox Ave
- 527 University Place
- 1132 E Citrus Ave
- 1424 Moore St
- 151 E Palm Lane Dr
- 17 W Palm Lane Dr
- 1442 Moore St
- 0 Campbell Ave
- 1426 5th Ave
- 1370 Oak St
- 246 E Fern Ave Unit 205
- 1452 Moore St
- 1458 Moore St
- 1454 E Highland Ave
- 250 E Fern Ave Unit 210
- 254 E Fern Ave Unit 212
Your Personal Tour Guide
Ask me questions while you tour the home.