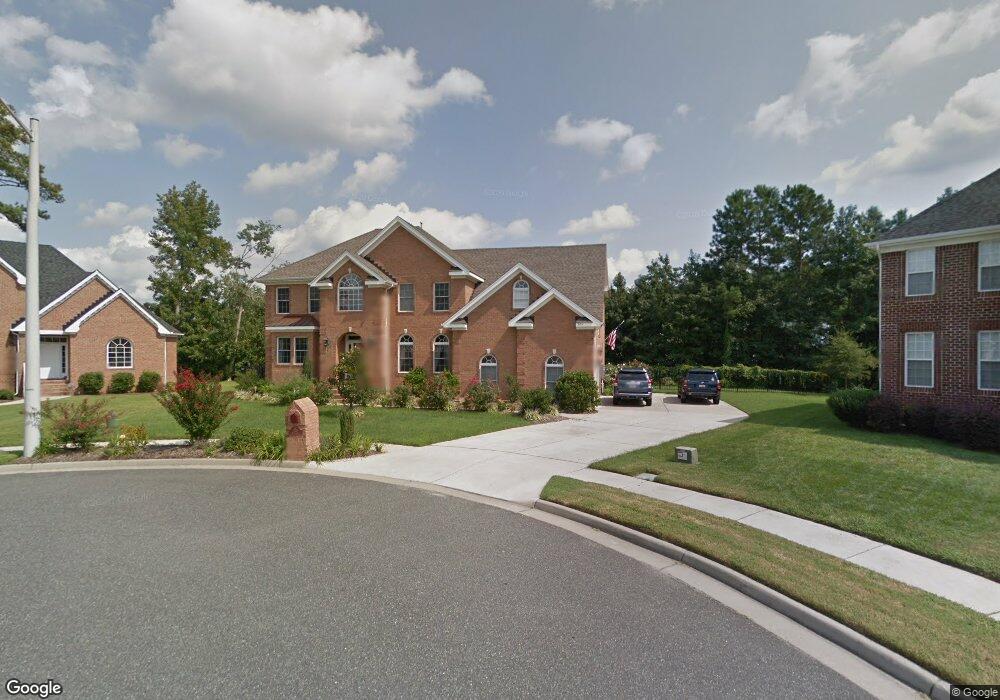
905 Brice Ct Chesapeake, VA 23322
Great Bridge NeighborhoodEstimated Value: $718,000 - $844,000
5
Beds
4
Baths
4,179
Sq Ft
$189/Sq Ft
Est. Value
About This Home
This home is located at 905 Brice Ct, Chesapeake, VA 23322 and is currently estimated at $791,699, approximately $189 per square foot. 905 Brice Ct is a home located in Chesapeake City with nearby schools including Great Bridge Primary School, Great Bridge Intermediate School, and Great Bridge Middle School.
Ownership History
Date
Name
Owned For
Owner Type
Purchase Details
Closed on
Jun 8, 2009
Sold by
Indymac Bank F S B
Bought by
Yohe James R
Current Estimated Value
Home Financials for this Owner
Home Financials are based on the most recent Mortgage that was taken out on this home.
Original Mortgage
$468,982
Outstanding Balance
$297,107
Interest Rate
4.82%
Mortgage Type
VA
Estimated Equity
$494,592
Purchase Details
Closed on
Feb 25, 2009
Sold by
Surety Trustees Llc Sub T
Bought by
Indymac Bank F S B
Purchase Details
Closed on
Aug 3, 2006
Sold by
S L Johnson Corp
Bought by
Fatherly Amos T
Home Financials for this Owner
Home Financials are based on the most recent Mortgage that was taken out on this home.
Original Mortgage
$474,000
Interest Rate
6.83%
Mortgage Type
New Conventional
Create a Home Valuation Report for This Property
The Home Valuation Report is an in-depth analysis detailing your home's value as well as a comparison with similar homes in the area
Home Values in the Area
Average Home Value in this Area
Purchase History
| Date | Buyer | Sale Price | Title Company |
|---|---|---|---|
| Yohe James R | $454,000 | -- | |
| Indymac Bank F S B | $434,589 | -- | |
| Fatherly Amos T | $592,500 | -- |
Source: Public Records
Mortgage History
| Date | Status | Borrower | Loan Amount |
|---|---|---|---|
| Open | Yohe James R | $468,982 | |
| Previous Owner | Fatherly Amos T | $474,000 |
Source: Public Records
Tax History Compared to Growth
Tax History
| Year | Tax Paid | Tax Assessment Tax Assessment Total Assessment is a certain percentage of the fair market value that is determined by local assessors to be the total taxable value of land and additions on the property. | Land | Improvement |
|---|---|---|---|---|
| 2025 | $7,172 | $748,900 | $190,000 | $558,900 |
| 2024 | $7,172 | $710,100 | $180,000 | $530,100 |
| 2023 | $7,436 | $736,200 | $170,000 | $566,200 |
| 2022 | $6,162 | $610,100 | $150,000 | $460,100 |
| 2021 | $5,813 | $553,600 | $125,000 | $428,600 |
| 2020 | $5,572 | $530,700 | $125,000 | $405,700 |
| 2019 | $5,361 | $510,600 | $125,000 | $385,600 |
| 2018 | $5,058 | $481,700 | $125,000 | $356,700 |
| 2017 | $5,058 | $481,700 | $125,000 | $356,700 |
| 2016 | $5,058 | $481,700 | $125,000 | $356,700 |
| 2015 | $5,015 | $477,600 | $125,000 | $352,600 |
| 2014 | $5,015 | $477,600 | $125,000 | $352,600 |
Source: Public Records
Map
Nearby Homes
- 917 Brice Ct
- 916 Brice Ct
- 904 Brice Ct
- 917 Barrington Ct
- 915 Forest Lakes Dr
- 821 Birch Forest Ct
- 701 Amberline Ct
- 708 Andover Ct
- 805 Maple Forest Ct
- 820 Spruce Forest Ct
- 823 Keeling Dr
- 922 Chattanooga St
- 813 Dawson Cir
- 500 Piping Rock Dr
- 570 Waters Rd
- 1073 Scenic Blvd
- 572 Akron Ave
- 1075 Scenic Blvd
- 577 Boston Ave
- 802 Dunwood Ct
- 900 Brice Ct
- 913 Brice Ct
- 908 Brice Ct
- 960 N Haven Cir
- 962 N Haven Cir
- 964 N Haven Cir
- 958 N Haven Cir
- 801 Brinn Quay
- 916 Barrington Ct
- 913 Barrington Ct
- 966 N Haven Cir
- 956 N Haven Cir
- 968 N Haven Cir
- 921 Brice Ct
- 912 Barrington Ct
- 920 Brice Ct
- 961 N Haven Cir
- 954 N Haven Cir
- 970 N Haven Cir
- 909 Barrington Ct