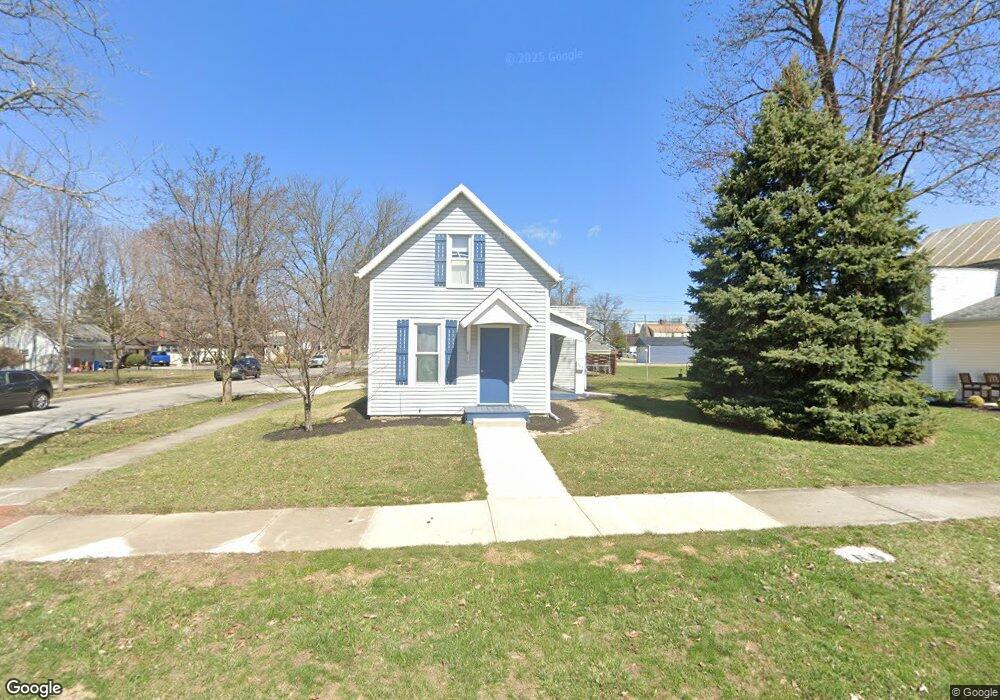
905 E 3rd St Ottawa, OH 45875
Estimated Value: $94,000 - $150,000
3
Beds
2
Baths
1,220
Sq Ft
$100/Sq Ft
Est. Value
About This Home
This home is located at 905 E 3rd St, Ottawa, OH 45875 and is currently estimated at $122,314, approximately $100 per square foot. 905 E 3rd St is a home located in Putnam County with nearby schools including Ottawa-Glandorf High School and Sts. Peter & Paul Catholic School.
Ownership History
Date
Name
Owned For
Owner Type
Purchase Details
Closed on
Dec 28, 2023
Sold by
Gerschutz Cynthia A
Bought by
Cramer Holdings Llc
Current Estimated Value
Purchase Details
Closed on
Sep 7, 2011
Sold by
Ruhe Michael J
Bought by
Honigfort Elizabeth and Gerschutz Cindy
Home Financials for this Owner
Home Financials are based on the most recent Mortgage that was taken out on this home.
Original Mortgage
$41,600
Interest Rate
4.59%
Mortgage Type
Purchase Money Mortgage
Purchase Details
Closed on
Feb 14, 2011
Sold by
Federal Home Loan Mortgage Corporation
Bought by
Ruhe Michael J
Purchase Details
Closed on
Jan 6, 2011
Sold by
Sherman Howard E
Bought by
Federal Home Loan Mortgage Corp
Create a Home Valuation Report for This Property
The Home Valuation Report is an in-depth analysis detailing your home's value as well as a comparison with similar homes in the area
Home Values in the Area
Average Home Value in this Area
Purchase History
| Date | Buyer | Sale Price | Title Company |
|---|---|---|---|
| Cramer Holdings Llc | -- | None Listed On Document | |
| Honigfort Elizabeth | $52,000 | None Available | |
| Ruhe Michael J | $21,000 | None Available | |
| Federal Home Loan Mortgage Corp | $42,750 | None Available |
Source: Public Records
Mortgage History
| Date | Status | Borrower | Loan Amount |
|---|---|---|---|
| Previous Owner | Honigfort Elizabeth | $41,600 |
Source: Public Records
Tax History
| Year | Tax Paid | Tax Assessment Tax Assessment Total Assessment is a certain percentage of the fair market value that is determined by local assessors to be the total taxable value of land and additions on the property. | Land | Improvement |
|---|---|---|---|---|
| 2025 | $694 | $20,620 | $3,040 | $17,580 |
| 2024 | $639 | $20,620 | $3,040 | $17,580 |
| 2023 | $678 | $16,170 | $2,350 | $13,820 |
| 2022 | $604 | $16,171 | $2,349 | $13,822 |
| 2021 | $607 | $16,170 | $2,350 | $13,820 |
| 2020 | $611 | $14,040 | $2,080 | $11,960 |
| 2019 | $551 | $14,530 | $2,350 | $12,180 |
| 2018 | $534 | $14,530 | $2,350 | $12,180 |
| 2017 | $511 | $14,530 | $2,350 | $12,180 |
| 2016 | $511 | $14,040 | $2,080 | $11,960 |
| 2015 | $515 | $14,040 | $2,080 | $11,960 |
| 2014 | $508 | $14,040 | $2,080 | $11,960 |
| 2013 | $506 | $14,040 | $2,080 | $11,960 |
Source: Public Records
Map
Nearby Homes
- 740 E Main St
- 717 E 2nd St
- 238 N Ohio Ave
- 370 S Thomas St
- 1535 E 3rd St
- 0 Sapphire St Unit 225029940
- 0 Sapphire St Unit 225046385
- 1731 S Agner St
- 715 N Perry St
- 1823 S Agner St
- 1997 E Main St
- 717 & 717 1/2 & 721 E Third St
- 309 Oakview Dr
- 113 Crabapple Ln
- 331 Chippewa Dr
- 9896 Road M
- 9410 Road H
- 5666 State Route 224
- 12806 Road K
- 13592 Ohio 694
Your Personal Tour Guide
Ask me questions while you tour the home.