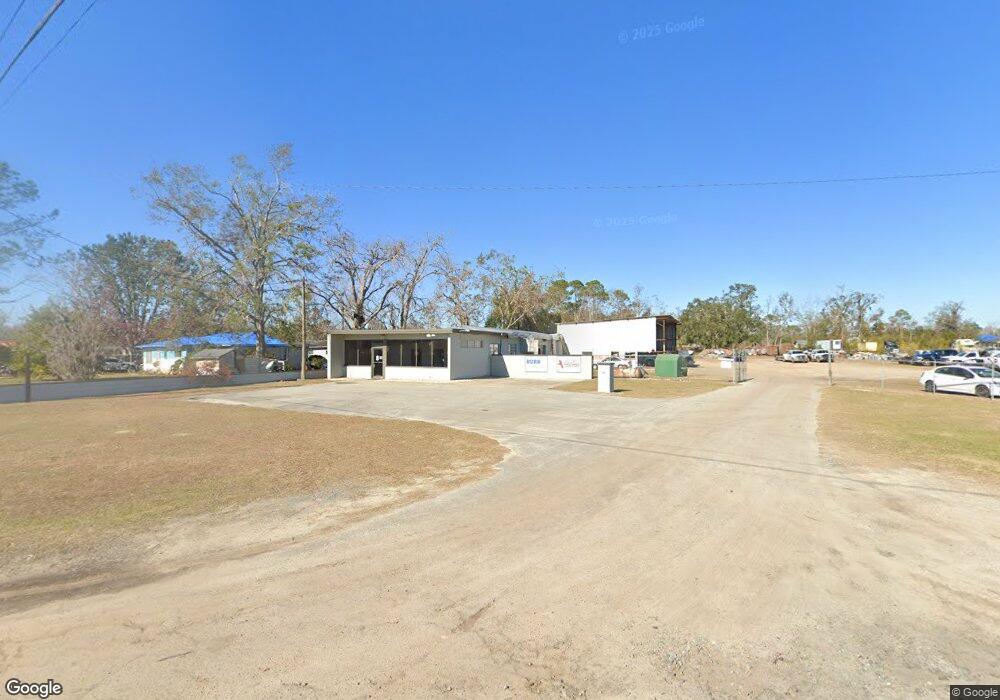
905 Howell Rd Valdosta, GA 31601
Estimated Value: $203,263
--
Bed
--
Bath
6,500
Sq Ft
$31/Sq Ft
Est. Value
About This Home
This home is located at 905 Howell Rd, Valdosta, GA 31601 and is currently estimated at $203,263, approximately $31 per square foot. 905 Howell Rd is a home located in Lowndes County with nearby schools including Moulton-Branch Elementary School, Lowndes Middle School, and Lowndes High School.
Ownership History
Date
Name
Owned For
Owner Type
Purchase Details
Closed on
Jun 6, 2025
Sold by
Edward Jennings Llc
Bought by
Jkb Properties Llc
Current Estimated Value
Home Financials for this Owner
Home Financials are based on the most recent Mortgage that was taken out on this home.
Original Mortgage
$200,000
Outstanding Balance
$188,661
Interest Rate
6.76%
Mortgage Type
New Conventional
Estimated Equity
$14,602
Purchase Details
Closed on
Feb 28, 2007
Sold by
Wead Development Co
Bought by
Edward Jennings Llc
Purchase Details
Closed on
Oct 20, 2004
Sold by
Park Avenue Bank
Bought by
Wead Development Co
Purchase Details
Closed on
Jan 14, 2004
Sold by
Guinn Transport Inc
Bought by
Park Avenue Bank
Purchase Details
Closed on
Jan 21, 1999
Sold by
Whiddon Van and Daniel Le
Bought by
Guinn Transport Inc
Purchase Details
Closed on
Aug 27, 1997
Bought by
Whiddon Van and Daniel Le
Purchase Details
Closed on
Feb 15, 1989
Bought by
Musgrove William D
Create a Home Valuation Report for This Property
The Home Valuation Report is an in-depth analysis detailing your home's value as well as a comparison with similar homes in the area
Home Values in the Area
Average Home Value in this Area
Purchase History
| Date | Buyer | Sale Price | Title Company |
|---|---|---|---|
| Jkb Properties Llc | $200,000 | -- | |
| Edward Jennings Llc | -- | -- | |
| Wead Development Co | $125,000 | -- | |
| Wead Development Co | $125,000 | -- | |
| Park Avenue Bank | $165,000 | -- | |
| Guinn Transport Inc | $200,000 | -- | |
| Whiddon Van | $150,000 | -- | |
| Musgrove William D | $65,000 | -- |
Source: Public Records
Mortgage History
| Date | Status | Borrower | Loan Amount |
|---|---|---|---|
| Open | Jkb Properties Llc | $200,000 |
Source: Public Records
Tax History Compared to Growth
Tax History
| Year | Tax Paid | Tax Assessment Tax Assessment Total Assessment is a certain percentage of the fair market value that is determined by local assessors to be the total taxable value of land and additions on the property. | Land | Improvement |
|---|---|---|---|---|
| 2024 | $3,000 | $118,216 | $63,250 | $54,966 |
| 2023 | $3,000 | $67,116 | $35,644 | $31,472 |
| 2022 | $1,871 | $67,116 | $35,644 | $31,472 |
| 2021 | $1,954 | $67,116 | $35,644 | $31,472 |
| 2020 | $1,815 | $67,116 | $35,644 | $31,472 |
| 2019 | $1,834 | $67,116 | $35,644 | $31,472 |
| 2018 | $1,853 | $67,116 | $35,644 | $31,472 |
| 2017 | $1,883 | $67,116 | $35,644 | $31,472 |
| 2016 | $1,888 | $67,116 | $35,644 | $31,472 |
| 2015 | $1,809 | $67,116 | $35,644 | $31,472 |
| 2014 | $1,763 | $64,098 | $44,532 | $19,567 |
Source: Public Records
Map
Nearby Homes
- 420 Griffin Ave
- 703 New Hudson St
- 10 Lavista Cir
- 1411 Willie Houseal Dr
- 4 Martin Luther King jr Cir
- 914 Bethune St
- 1301 Bethune St
- 1302 Bethune St
- 1306 Bethune St
- 201 Cummings Place
- 1314 Partridge Place
- 200 Deloach St
- 0 Hampton Ln
- 0 New Statenville Hwy
- 1412 San Bernardino Way
- 1610 Natcon St
- 0 Howell Rd
- 7 W Hill Ave
- 105 N Ashley St
- 412 Barack Obama Blvd
- 808 Griffin Ave
- 800 1/2 Griffin Ave
- 800 Griffin Ave
- 0 Griffin Dr Unit 3202338
- 0 Griffin Dr
- 839 Bennett St
- 610 Ulmer Ave
- 827 Bennett St Unit B
- 827 Bennett St Unit B
- 827 Bennett St Unit B
- 704 Conoley Ave
- 1704 Ulmer Ave
- 608 Ulmer Ave
- 1702 Ulmer Ave
- 696 Griffin Ave
- 701 Conoley Ave
- 805 Paine Ave
- 833 Clifton Dr
- 837 Clifton Dr
- 1700 Ulmer Ave