Estimated Value: $333,548 - $391,000
4
Beds
2
Baths
1,192
Sq Ft
$306/Sq Ft
Est. Value
About This Home
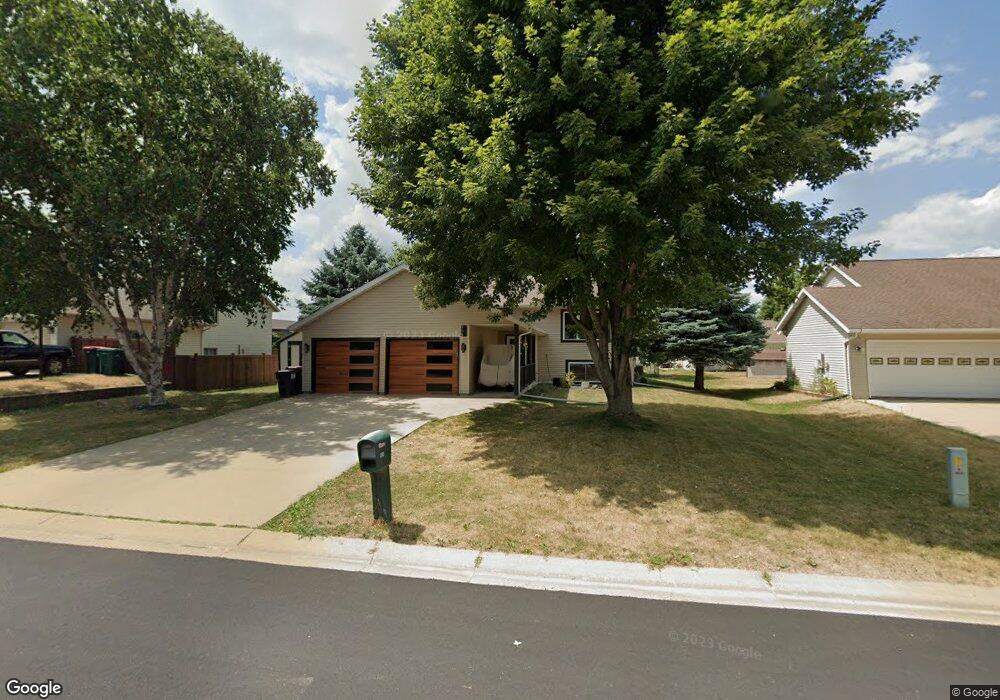
This home is located at 905 Jefferson Ave SW, Eyota, MN 55934 and is currently estimated at $364,637, approximately $305 per square foot. 905 Jefferson Ave SW is a home located in Olmsted County with nearby schools including Dover-Eyota Elementary School, Dover-Eyota Middle School, and Dover-Eyota High School.
Ownership History
Date
Name
Owned For
Owner Type
Purchase Details
Closed on
Aug 4, 2009
Sold by
Waldemar Sarah E and Waldemar Dallas
Bought by
Curry Travis and Curry Jessica
Current Estimated Value
Home Financials for this Owner
Home Financials are based on the most recent Mortgage that was taken out on this home.
Original Mortgage
$174,284
Outstanding Balance
$113,866
Interest Rate
5.25%
Mortgage Type
FHA
Estimated Equity
$250,771
Purchase Details
Closed on
Oct 3, 2006
Sold by
Secretary Of Veterans Affairs
Bought by
Waldemar Sarah E and Waldemar Dallas
Home Financials for this Owner
Home Financials are based on the most recent Mortgage that was taken out on this home.
Original Mortgage
$114,800
Interest Rate
6.47%
Mortgage Type
New Conventional
Purchase Details
Closed on
Aug 18, 2005
Sold by
Wagner Daniel and Wagner Jody
Bought by
Mortgage Electronic Registration Systems
Create a Home Valuation Report for This Property
The Home Valuation Report is an in-depth analysis detailing your home's value as well as a comparison with similar homes in the area
Home Values in the Area
Average Home Value in this Area
Purchase History
| Date | Buyer | Sale Price | Title Company |
|---|---|---|---|
| Curry Travis | $177,500 | Rochester Title | |
| Waldemar Sarah E | -- | West Title Llc | |
| Mortgage Electronic Registration Systems | $136,602 | None Available |
Source: Public Records
Mortgage History
| Date | Status | Borrower | Loan Amount |
|---|---|---|---|
| Open | Curry Travis | $174,284 | |
| Previous Owner | Waldemar Sarah E | $114,800 |
Source: Public Records
Tax History Compared to Growth
Tax History
| Year | Tax Paid | Tax Assessment Tax Assessment Total Assessment is a certain percentage of the fair market value that is determined by local assessors to be the total taxable value of land and additions on the property. | Land | Improvement |
|---|---|---|---|---|
| 2024 | $3,804 | $282,600 | $40,000 | $242,600 |
| 2023 | $3,630 | $283,300 | $40,000 | $243,300 |
| 2022 | $3,320 | $259,700 | $40,000 | $219,700 |
| 2021 | $3,380 | $231,800 | $35,000 | $196,800 |
| 2020 | $3,548 | $217,100 | $30,000 | $187,100 |
| 2019 | $3,270 | $214,100 | $30,000 | $184,100 |
| 2018 | $2,990 | $199,300 | $30,000 | $169,300 |
| 2017 | $2,924 | $192,600 | $30,000 | $162,600 |
| 2016 | $2,858 | $184,500 | $30,000 | $154,500 |
| 2015 | $2,692 | $160,800 | $30,000 | $130,800 |
| 2014 | $2,456 | $162,200 | $30,000 | $132,200 |
| 2012 | -- | $160,100 | $30,000 | $130,100 |
Source: Public Records
Map
Nearby Homes
- 314 7th St SW
- 19 5th St SE
- 227 4th St SW
- 308 Spring Day Ct NE
- 134 Rena Belle St NW
- 223 Rena Belle St NW
- 416 Spring Day Ave NE
- 580 Canyon Ln NW
- 577 Keefe Ct NW
- 156 Sandstone Dr NW
- 158 Sandstone Dr NW
- 13331 40th St SE
- TBD 30th St SE
- TBD 150th Ave SE
- 241 6th St
- 70xx 54th St SE
- tbd 70th St SE
- 7235 Highway 14 E
- 2605 County Highway 7 NE
- 52XX 70th Ave SE
- 909 Jefferson Ave SW
- 901 Jefferson Ave SW
- 906 Donna Ct SW
- 318 Glen St SW
- 910 Donna Ct SW
- 913 Jefferson Ave SW
- 913 Jefferson Ave S
- 904 Jefferson Ave SW
- 914 Donna Ct SW
- 908 Jefferson Ave SW
- 900 Jefferson Ave SW
- 311 Glen St SW
- 912 Jefferson Ave SW
- 820 Jefferson Ave SW
- 918 Donna Ct SW
- 401 Glen St SW
- 917 Jefferson Ave SW
- 916 Jefferson Ave SW
- 816 Jefferson Ave SW
- 813 Jefferson Ave SW