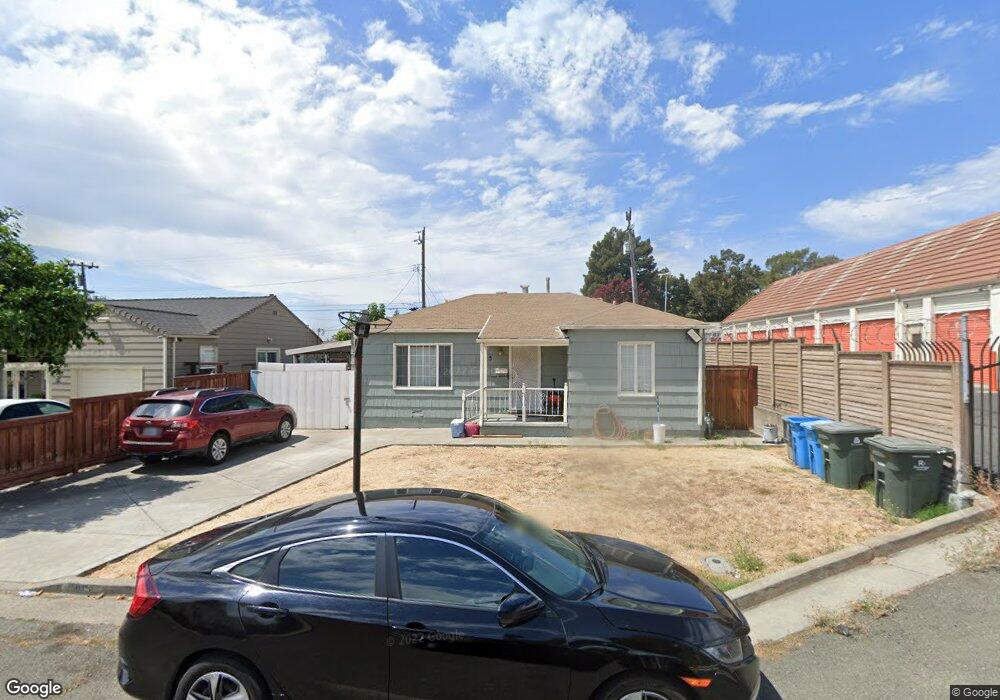
905 Modoc St Vallejo, CA 94591
Estimated Value: $372,085 - $418,000
2
Beds
1
Bath
837
Sq Ft
$476/Sq Ft
Est. Value
About This Home
This home is located at 905 Modoc St, Vallejo, CA 94591 and is currently estimated at $398,021, approximately $475 per square foot. 905 Modoc St is a home located in Solano County with nearby schools including Steffan Manor Elementary, Hogan Middle School, and Jesse M. Bethel High School.
Ownership History
Date
Name
Owned For
Owner Type
Purchase Details
Closed on
Jul 19, 2010
Sold by
Gutierrez Arturo and Gutierrez Cristina
Bought by
Wells Fargo Bank Na
Current Estimated Value
Purchase Details
Closed on
Sep 17, 1999
Sold by
Arturo Gutierrez and Arturo C M
Bought by
Gutierrez Arturo and Gutierrez Cristina
Home Financials for this Owner
Home Financials are based on the most recent Mortgage that was taken out on this home.
Original Mortgage
$95,250
Interest Rate
8.09%
Purchase Details
Closed on
Sep 29, 1995
Sold by
The Northern California Conference Assn
Bought by
Gutierrez Arturo and Gutierrez Cristina Moreno
Home Financials for this Owner
Home Financials are based on the most recent Mortgage that was taken out on this home.
Original Mortgage
$76,000
Interest Rate
7.92%
Purchase Details
Closed on
Sep 29, 1994
Sold by
Meyers Gladys M
Bought by
Northern California Conference Assn Of S
Create a Home Valuation Report for This Property
The Home Valuation Report is an in-depth analysis detailing your home's value as well as a comparison with similar homes in the area
Purchase History
We collect this data history from publicly available records. To have your information removed, we recommend requesting removal directly through your county’s website.
| Date | Buyer | Sale Price | Title Company |
|---|---|---|---|
| Wells Fargo Bank Na | $89,261 | Accommodation | |
| Gutierrez Arturo | -- | Frontier Title Company | |
| Gutierrez Arturo | $80,000 | North American Title Co | |
| Northern California Conference Assn Of S | -- | -- |
Source: Public Records
Mortgage History
We collect this data history from publicly available records. To have your information removed, we recommend requesting removal directly through your county’s website.
| Date | Status | Borrower | Loan Amount |
|---|---|---|---|
| Previous Owner | Gutierrez Arturo | $95,250 | |
| Previous Owner | Gutierrez Arturo | $76,000 |
Source: Public Records
Tax History
| Year | Tax Paid | Tax Assessment Tax Assessment Total Assessment is a certain percentage of the fair market value that is determined by local assessors to be the total taxable value of land and additions on the property. | Land | Improvement |
|---|---|---|---|---|
| 2025 | $2,721 | $132,896 | $49,835 | $83,061 |
| 2024 | $2,721 | $130,291 | $48,858 | $81,433 |
| 2023 | $2,412 | $127,737 | $47,900 | $79,837 |
| 2022 | $2,304 | $125,233 | $46,961 | $78,272 |
| 2021 | $2,251 | $122,779 | $46,041 | $76,738 |
| 2020 | $2,241 | $121,521 | $45,569 | $75,952 |
| 2019 | $2,154 | $119,139 | $44,676 | $74,463 |
| 2018 | $2,003 | $116,803 | $43,800 | $73,003 |
| 2017 | $1,895 | $114,514 | $42,942 | $71,572 |
| 2016 | $1,325 | $112,269 | $42,100 | $70,169 |
| 2015 | $1,469 | $110,583 | $41,468 | $69,115 |
| 2014 | $1,290 | $108,418 | $40,656 | $67,762 |
Source: Public Records
Map
Nearby Homes
- 901 Humboldt St
- 741 Vervais Ave
- 711 State St
- 2039 Tennessee St
- 136 University Ave
- 2015 Tennessee St
- 1509 Lassen Ct
- 1939 Indiana St
- 104 Foster St
- 1117 Maple Ave
- 100 Ross St
- 700 Springs Rd
- 1012 Mariposa St
- 129 Foster St
- 453 Clark Dr
- 20 Chesley Ct
- 1048 Western Ave
- 116 Revere St
- 1930 L Ellenburg St
- 126 Skyway Dr
Your Personal Tour Guide
Ask me questions while you tour the home.