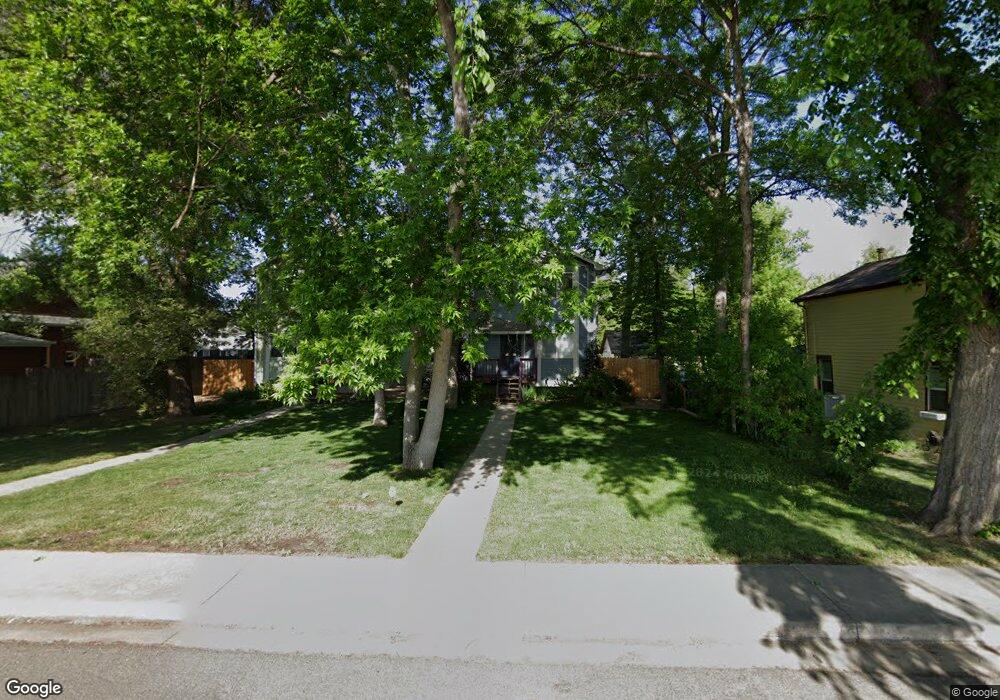
905 Terry St Longmont, CO 80501
Loomiller NeighborhoodEstimated Value: $667,000 - $945,000
3
Beds
2
Baths
2,640
Sq Ft
$299/Sq Ft
Est. Value
About This Home
This home is located at 905 Terry St, Longmont, CO 80501 and is currently estimated at $789,884, approximately $299 per square foot. 905 Terry St is a home located in Boulder County with nearby schools including Mountain View Elementary School, Longs Peak Middle School, and Longmont High School.
Ownership History
Date
Name
Owned For
Owner Type
Purchase Details
Closed on
May 1, 2013
Sold by
Zia Trust Inc
Bought by
Provident Trust Group Llc and Florianne A White Ira
Current Estimated Value
Purchase Details
Closed on
Feb 17, 2009
Sold by
Bowman Fern M and Rutledge Jeanne Z
Bought by
Zia Trust Inc and Florianne White Ira
Purchase Details
Closed on
Jun 28, 1996
Sold by
Red Brown Corp
Bought by
Bowman Fern M
Home Financials for this Owner
Home Financials are based on the most recent Mortgage that was taken out on this home.
Original Mortgage
$137,450
Interest Rate
8.05%
Purchase Details
Closed on
Sep 7, 1995
Sold by
Lmhj Construction Corp
Bought by
Red Brown Corp
Purchase Details
Closed on
Feb 22, 1995
Sold by
Dunn Thomas L
Bought by
Dunn Thomas L
Create a Home Valuation Report for This Property
The Home Valuation Report is an in-depth analysis detailing your home's value as well as a comparison with similar homes in the area
Home Values in the Area
Average Home Value in this Area
Purchase History
| Date | Buyer | Sale Price | Title Company |
|---|---|---|---|
| Provident Trust Group Llc | -- | None Available | |
| Zia Trust Inc | $340,000 | Guardian Title | |
| Bowman Fern M | $248,500 | -- | |
| Red Brown Corp | $49,500 | -- | |
| Lmhj Construction Corp | -- | -- | |
| Dunn Thomas L | -- | -- | |
| Dunn Thomas L | $26,000 | -- | |
| Dunn Thomas L | $26,000 | -- |
Source: Public Records
Mortgage History
| Date | Status | Borrower | Loan Amount |
|---|---|---|---|
| Previous Owner | Bowman Fern M | $137,450 |
Source: Public Records
Tax History
| Year | Tax Paid | Tax Assessment Tax Assessment Total Assessment is a certain percentage of the fair market value that is determined by local assessors to be the total taxable value of land and additions on the property. | Land | Improvement |
|---|---|---|---|---|
| 2025 | $4,902 | $50,719 | $6,763 | $43,956 |
| 2024 | $4,902 | $50,719 | $6,763 | $43,956 |
| 2023 | $4,902 | $51,952 | $7,531 | $48,106 |
| 2022 | $4,288 | $43,333 | $5,539 | $37,794 |
| 2021 | $4,344 | $44,581 | $5,699 | $38,882 |
| 2020 | $3,898 | $40,126 | $4,934 | $35,192 |
| 2019 | $3,836 | $40,126 | $4,934 | $35,192 |
| 2018 | $3,492 | $36,764 | $4,464 | $32,300 |
| 2017 | $3,445 | $40,643 | $4,935 | $35,708 |
| 2016 | $3,314 | $34,673 | $6,925 | $27,748 |
| 2015 | $3,158 | $31,666 | $10,030 | $21,636 |
| 2014 | $2,958 | $31,666 | $10,030 | $21,636 |
Source: Public Records
Map
Nearby Homes
Your Personal Tour Guide
Ask me questions while you tour the home.