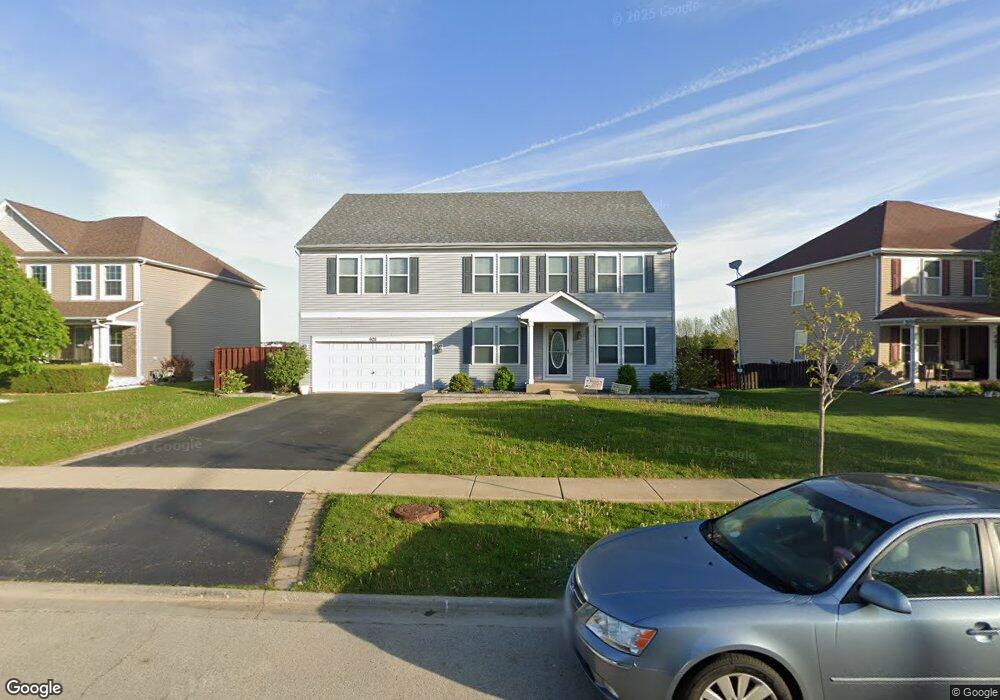
905 Treesdale Way Unit 2 Joliet, IL 60431
North Minooka NeighborhoodEstimated Value: $428,000 - $482,000
3
Beds
3
Baths
3,160
Sq Ft
$141/Sq Ft
Est. Value
About This Home
This home is located at 905 Treesdale Way Unit 2, Joliet, IL 60431 and is currently estimated at $445,184, approximately $140 per square foot. 905 Treesdale Way Unit 2 is a home located in Kendall County with nearby schools including Jones Elementary School, Minooka Junior High School, and Minooka Intermediate School.
Ownership History
Date
Name
Owned For
Owner Type
Purchase Details
Closed on
Jul 23, 2021
Sold by
Geers Kevin M and Geers Dawn M
Bought by
Geers Kevin M and Geers Dawn M
Current Estimated Value
Home Financials for this Owner
Home Financials are based on the most recent Mortgage that was taken out on this home.
Original Mortgage
$177,000
Outstanding Balance
$133,534
Interest Rate
2.2%
Mortgage Type
New Conventional
Estimated Equity
$311,650
Purchase Details
Closed on
Jan 27, 2011
Sold by
Rbc Real Estate Finance Inc
Bought by
Geers Kevin M
Home Financials for this Owner
Home Financials are based on the most recent Mortgage that was taken out on this home.
Original Mortgage
$180,310
Interest Rate
4.89%
Mortgage Type
FHA
Purchase Details
Closed on
Dec 31, 2008
Sold by
Kennedy Homes Limited Partnership
Bought by
Rbc Real Estate Finance Inc
Create a Home Valuation Report for This Property
The Home Valuation Report is an in-depth analysis detailing your home's value as well as a comparison with similar homes in the area
Home Values in the Area
Average Home Value in this Area
Purchase History
| Date | Buyer | Sale Price | Title Company |
|---|---|---|---|
| Geers Kevin M | -- | Ravenswood Title | |
| Geers Kevin M | $185,000 | First American Title Ins Co | |
| Rbc Real Estate Finance Inc | -- | None Available |
Source: Public Records
Mortgage History
| Date | Status | Borrower | Loan Amount |
|---|---|---|---|
| Open | Geers Kevin M | $177,000 | |
| Previous Owner | Geers Kevin M | $180,310 |
Source: Public Records
Tax History Compared to Growth
Tax History
| Year | Tax Paid | Tax Assessment Tax Assessment Total Assessment is a certain percentage of the fair market value that is determined by local assessors to be the total taxable value of land and additions on the property. | Land | Improvement |
|---|---|---|---|---|
| 2024 | $9,759 | $121,028 | $15,306 | $105,722 |
| 2023 | $8,622 | $111,969 | $14,042 | $97,927 |
| 2022 | $8,622 | $104,000 | $14,042 | $89,958 |
| 2021 | $8,358 | $98,507 | $14,256 | $84,251 |
| 2020 | $7,598 | $88,563 | $14,055 | $74,508 |
| 2019 | $7,942 | $90,546 | $13,724 | $76,822 |
| 2018 | $7,934 | $90,546 | $13,724 | $76,822 |
| 2017 | $7,773 | $84,950 | $13,027 | $71,923 |
| 2016 | $6,749 | $73,767 | $12,866 | $60,901 |
| 2015 | $6,145 | $66,846 | $12,210 | $54,636 |
| 2014 | -- | $61,968 | $12,210 | $49,758 |
| 2013 | -- | $62,983 | $12,210 | $50,773 |
Source: Public Records
Map
Nearby Homes
- 1002 Hudson Dr
- 1112 Kim Ct
- 7807 Nightshade Ln
- 1102 Nikki Ct
- 7810 Nightshade Ln
- 7608 Nightshade Ln
- Davis II Plan at Lakewood Prairie - Townhomes
- Everton II Plan at Lakewood Prairie - Townhomes
- Glenshire II Plan at Lakewood Prairie - Townhomes
- Courtney II Plan at Lakewood Prairie - Townhomes
- 1210 Fawnlily Cir
- 1306 Bassett Dr
- 7607 Currant Dr
- 7601 Honeysuckle Ln
- 7511 Currant Dr
- 7509 Honeysuckle Ln
- 7511 Honeysuckle Ln
- 7811 Nightshade Ln
- 7513 Currant Dr
- 7815 Nightshade Ln
- 907 Treesdale Way
- 903 Treesdale Way
- 903 Treesdale Lot # 107 Way
- 909 Treesdale Lot #104 Way
- 901 Treesdale Way
- 811 Branden Ct
- 911 Treesdale Way
- 902 Treesdale Way
- 815 Treesdale Way
- 812 Treesdale Way
- 809 Branden Lot#191 Ct
- 904 Treesdale Way
- 913 Treesdale Way
- 906 Treesdale Way
- 813 Treesdale Way
- 810 Treesdale Lot#188 Way
- 810 Treesdale Way
- 810 Branden Ct
- 908 Treesdale Way
- 807 Branden Ct