


905 W 8th St Kannapolis, NC 28081
Estimated payment $1,448/month
Highlights
- Corner Lot
- Covered Patio or Porch
- Laundry Room
- No HOA
- 2 Car Detached Garage
- 1-Story Property
About This Home
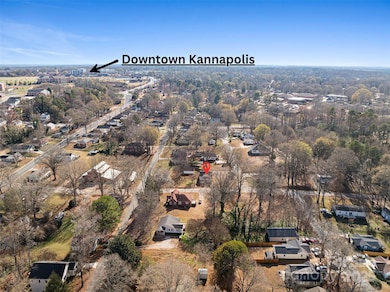
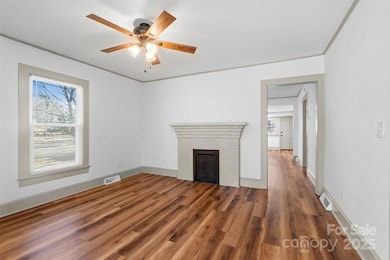
Location, Location, Location! Charming 2 bedroom, 1 bathroom home situated on a fantastic corner lot. You'll be just moments from vibrant downtown Kannapolis and only blocks away from local favorites like Village Park, Bakers Creek Park, and the city greenway! The curb appeal is undeniable, centered around an ideal, large concrete front porch which is perfectly primed for your rocking chairs to relax and enjoy quiet afternoons in the shade. Step inside to find a beautifully updated interior featuring a fresh coat of paint throughout, an upgraded kitchen with sleek stainless steel appliances, and luxury vinyl plank flooring. The spacious corner lot offers significant value, providing the potential for an Auxiliary Dwelling Unit (ADU), subject to local approval. Plus, the detached garage is ready for customization; some elbow grease would go a long way to transform it into a functional workshop, a dedicated storage space, or your classic parking spot! If you're looking for a move-in ready home that perfectly balances a quiet, established neighborhood feel with unbeatable access to urban amenities and future possibilities, this is absolutely the one!
Listing Agent
Redwood Realty Group LLC Brokerage Email: Shelly@greenwaldandco.com License #309668 Listed on: 12/10/2025
Home Details
Home Type
- Single Family
Year Built
- Built in 1933
Lot Details
- Corner Lot
- Property is zoned R8
Parking
- 2 Car Detached Garage
- Detached Carport Space
Home Design
- Architectural Shingle Roof
- Vinyl Siding
Interior Spaces
- 1-Story Property
- Vinyl Flooring
- Crawl Space
- Laundry Room
Kitchen
- Electric Range
- Microwave
- Dishwasher
Bedrooms and Bathrooms
- 2 Main Level Bedrooms
- 1 Full Bathroom
Outdoor Features
- Covered Patio or Porch
Schools
- North Kannapolis Elementary School
- Kannapolis Middle School
- A.L. Brown High School
Utilities
- Central Air
- Heat Pump System
Community Details
- No Home Owners Association
Listing and Financial Details
- Assessor Parcel Number 148101
Map
Home Values in the Area
Average Home Value in this Area
Tax History
| Year | Tax Paid | Tax Assessment Tax Assessment Total Assessment is a certain percentage of the fair market value that is determined by local assessors to be the total taxable value of land and additions on the property. | Land | Improvement |
|---|---|---|---|---|
| 2025 | $1,578 | $130,419 | $37,375 | $93,044 |
| 2024 | $1,578 | $130,419 | $37,375 | $93,044 |
| 2023 | $1,578 | $130,419 | $37,375 | $93,044 |
| 2022 | $1,030 | $80,020 | $26,565 | $53,455 |
| 2021 | $1,030 | $80,020 | $26,565 | $53,455 |
| 2020 | $1,030 | $80,020 | $26,565 | $53,455 |
| 2019 | $1,030 | $80,020 | $26,565 | $53,455 |
| 2018 | $889 | $69,831 | $26,593 | $43,238 |
| 2017 | $889 | $69,831 | $26,593 | $43,238 |
| 2016 | $889 | $69,831 | $26,593 | $43,238 |
| 2015 | $903 | $69,831 | $26,593 | $43,238 |
| 2014 | $827 | $66,177 | $21,275 | $44,902 |
Property History
| Date | Event | Price | List to Sale | Price per Sq Ft |
|---|---|---|---|---|
| 12/10/2025 12/10/25 | For Sale | $250,000 | -- | $238 / Sq Ft |
Purchase History
| Date | Type | Sale Price | Title Company |
|---|---|---|---|
| Deed | -- | None Listed On Document | |
| Deed | -- | None Listed On Document | |
| Warranty Deed | -- | None Available | |
| Warranty Deed | $57,000 | None Available | |
| Warranty Deed | -- | -- |
Mortgage History
| Date | Status | Loan Amount | Loan Type |
|---|---|---|---|
| Previous Owner | $197,500 | Commercial | |
| Previous Owner | $68,000 | Commercial |
Source: Canopy MLS (Canopy Realtor® Association)
MLS Number: 4326053
APN: 148-101
Disclaimer: Certain information contained herein is derived from information provided by parties other than Homes.com. All information provided is deemed reliable, but is not guaranteed to be accurate and should be independently verified.
![]() Based on information submitted to the MLS GRID. All data is obtained from various sources and may not have been verified by broker or MLS GRID. Supplied Open House Information is subject to change without notice. All information should be independently reviewed and verified for accuracy. Properties may or may not be listed by the office/agent presenting the information. Some IDX listings have been excluded from this website.
Based on information submitted to the MLS GRID. All data is obtained from various sources and may not have been verified by broker or MLS GRID. Supplied Open House Information is subject to change without notice. All information should be independently reviewed and verified for accuracy. Properties may or may not be listed by the office/agent presenting the information. Some IDX listings have been excluded from this website.
The Digital Millennium Copyright Act of 1998, 17 U.S.C. § 512 (the “DMCA”) provides recourse for copyright owners who believe that material appearing on the Internet infringes their rights under U.S. copyright law. If you believe in good faith that any content or material made available in connection with our website or services infringes your copyright, you (or your agent) may send us a notice requesting that the content or material be removed, or access to it blocked.
Notices must be sent in writing by email to DMCAnotice@MLSGrid.com.
The DMCA requires that your notice of alleged copyright infringement include the following information:
(1) description of the copyrighted work that is the subject of claimed infringement;
(2) description of the alleged infringing content and information sufficient to permit us to locate the content;
(3) contact information for you, including your address, telephone number and email address;
(4) a statement by you that you have a good faith belief that the content in the manner complained of is not authorized by the copyright owner, or its agent, or by the operation of any law;
(5) a statement by you, signed under penalty of perjury, that the information in the notification is accurate and that you have the authority to enforce the copyrights that are claimed to be infringed; and
(6) a physical or electronic signature of the copyright owner or a person authorized to act on the copyright owner’s behalf. Failure to include all of the above information may result in the delay of the processing of your complaint.
- 814 W A St
- 1204 W A St
- 100 Fir Ave
- 1302 W A St
- 108 Hemlock Ave
- 602 W 8th St
- 604 W 8th St
- 600 W 8th St
- 950 Ashby St
- 1409 Enochville Rd
- 509 W 9th St
- 0 W C St Unit 2 CAR4255761
- 0 W C St Unit CAR4255556
- 510 W 9th St
- 122 Andrew St
- 504 Locust St
- 1110 Northside St
- 0 Pump Station Rd
- Lot 2 Arden Ave
- Lot 1 Arden Ave
- 607 Forest Ave
- 604 W 8th St
- 805 Keller Ave
- 92 Akron Ave
- 131 Wayne Ave
- 606 Church Ave
- 120 West Ave
- 210 S Main St
- 120 S East Ave
- 226 Pethel St
- 1005 Rainbow Dr
- 517 Broad St Unit A
- 507 W 22nd St Unit B
- 4301 Forestridge Ln
- 1923 Crestmont St
- 701 Rain Place Ct
- 608 Bethpage Rd
- 110 W 22nd St
- 705 Oakshade Ave
- 703 Louise Ave
