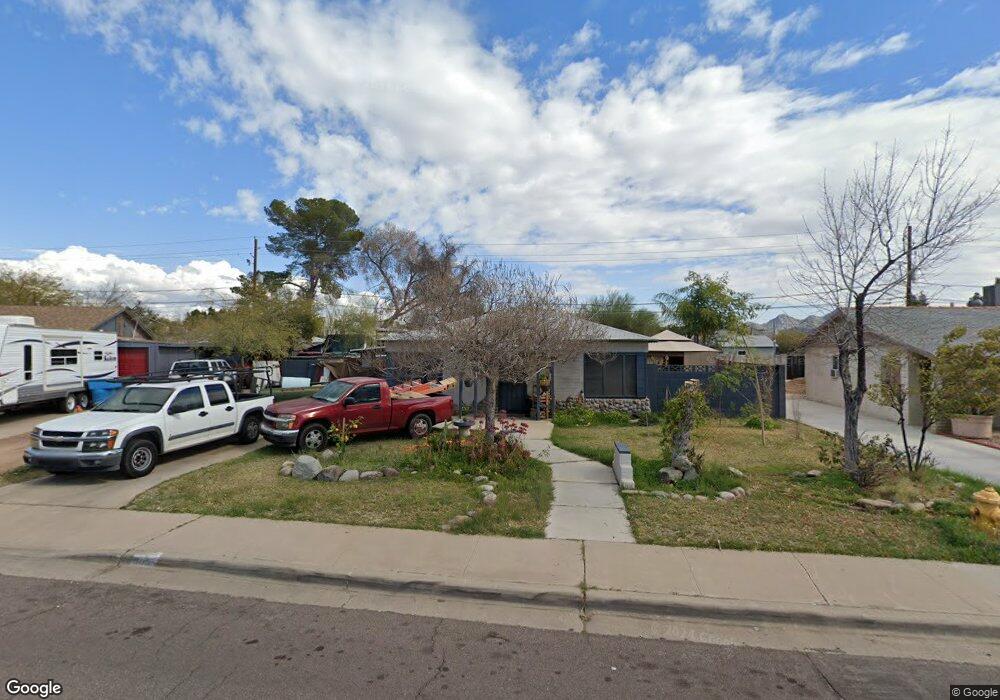
9055 N 2nd Dr Phoenix, AZ 85021
North Central NeighborhoodEstimated Value: $270,647 - $351,000
Studio
1
Bath
1,260
Sq Ft
$259/Sq Ft
Est. Value
About This Home
This home is located at 9055 N 2nd Dr, Phoenix, AZ 85021 and is currently estimated at $326,412, approximately $259 per square foot. 9055 N 2nd Dr is a home located in Maricopa County with nearby schools including Mountain View Elementary School, Sunnyslope High School, and Bennett Academy – Venture Site.
Ownership History
Date
Name
Owned For
Owner Type
Purchase Details
Closed on
Feb 24, 2001
Sold by
Parsons Dolores M
Bought by
Parsons Fredric H
Current Estimated Value
Create a Home Valuation Report for This Property
The Home Valuation Report is an in-depth analysis detailing your home's value as well as a comparison with similar homes in the area
Home Values in the Area
Average Home Value in this Area
Purchase History
| Date | Buyer | Sale Price | Title Company |
|---|---|---|---|
| Parsons Fredric H | -- | -- |
Source: Public Records
Tax History
| Year | Tax Paid | Tax Assessment Tax Assessment Total Assessment is a certain percentage of the fair market value that is determined by local assessors to be the total taxable value of land and additions on the property. | Land | Improvement |
|---|---|---|---|---|
| 2025 | $832 | $6,547 | -- | -- |
| 2024 | $786 | $6,236 | -- | -- |
| 2023 | $786 | $25,210 | $5,040 | $20,170 |
| 2022 | $761 | $17,970 | $3,590 | $14,380 |
| 2021 | $770 | $17,860 | $3,570 | $14,290 |
| 2020 | $751 | $15,970 | $3,190 | $12,780 |
| 2019 | $737 | $14,170 | $2,830 | $11,340 |
| 2018 | $803 | $13,210 | $2,640 | $10,570 |
| 2017 | $630 | $11,350 | $2,270 | $9,080 |
| 2016 | $619 | $9,850 | $1,970 | $7,880 |
| 2015 | $574 | $6,730 | $1,340 | $5,390 |
Source: Public Records
Map
Nearby Homes
- 203 W Mission Ln
- 29 W Mission Ln
- 312 W Mission Ln Unit 9
- 16 E Hatcher Rd
- 306 W Camino Vista
- 9001 N 7th Ave
- 9610 N 2nd St
- 225 W Alice Ave
- 135 W Alice Ave
- 226 E Carol Ave
- 714 W Townley Ave
- 8910 N 3rd St
- 9820 N Central Ave Unit 123
- 9820 N Central Ave Unit 102
- 9829 N 4th Ave
- 9425 N 9th Ave
- 8814 N 2nd Way
- 8915 N Drey Ln
- 315 E Carol Ave
- 9826 N 2nd St
Your Personal Tour Guide
Ask me questions while you tour the home.