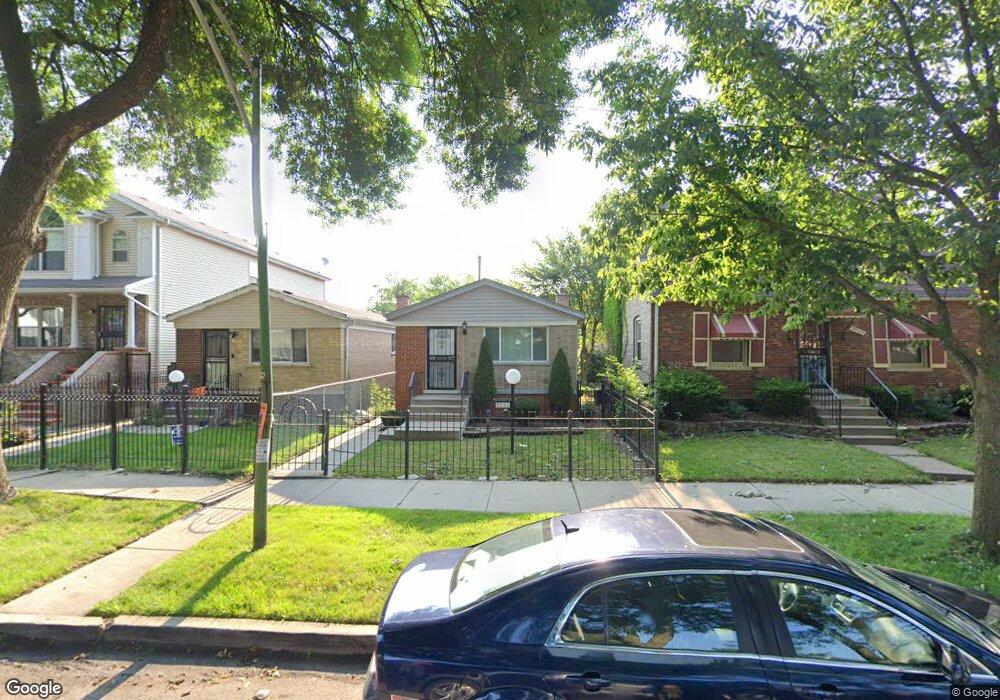
9055 S Lowe Ave Chicago, IL 60620
Brainerd NeighborhoodEstimated Value: $183,000 - $228,000
3
Beds
2
Baths
969
Sq Ft
$208/Sq Ft
Est. Value
About This Home
This home is located at 9055 S Lowe Ave, Chicago, IL 60620 and is currently estimated at $201,432, approximately $207 per square foot. 9055 S Lowe Ave is a home located in Cook County with nearby schools including Ryder Elementary Math & Sci Spec School, Harlan Community Academy High School, and Hansberry College Prep.
Ownership History
Date
Name
Owned For
Owner Type
Purchase Details
Closed on
Oct 16, 2018
Sold by
Navarro Willis Jovan and Navarro Willis
Bought by
Willis Navarro
Current Estimated Value
Home Financials for this Owner
Home Financials are based on the most recent Mortgage that was taken out on this home.
Original Mortgage
$134,830
Outstanding Balance
$118,116
Interest Rate
5%
Mortgage Type
New Conventional
Estimated Equity
$83,316
Purchase Details
Closed on
Dec 4, 2009
Sold by
Chicagoland Rehab Network Ltd
Bought by
Navarro Willis Jovan and Navarro Willis
Home Financials for this Owner
Home Financials are based on the most recent Mortgage that was taken out on this home.
Original Mortgage
$156,120
Interest Rate
4.96%
Mortgage Type
FHA
Purchase Details
Closed on
Feb 27, 2009
Sold by
Floyd Isiah
Bought by
Chicago Land Rehab Network Ltd
Create a Home Valuation Report for This Property
The Home Valuation Report is an in-depth analysis detailing your home's value as well as a comparison with similar homes in the area
Home Values in the Area
Average Home Value in this Area
Purchase History
| Date | Buyer | Sale Price | Title Company |
|---|---|---|---|
| Willis Navarro | -- | Servicelink | |
| Navarro Willis Jovan | $159,000 | Git | |
| Chicago Land Rehab Network Ltd | $37,000 | None Available |
Source: Public Records
Mortgage History
| Date | Status | Borrower | Loan Amount |
|---|---|---|---|
| Open | Willis Navarro | $134,830 | |
| Closed | Navarro Willis Jovan | $156,120 |
Source: Public Records
Tax History
| Year | Tax Paid | Tax Assessment Tax Assessment Total Assessment is a certain percentage of the fair market value that is determined by local assessors to be the total taxable value of land and additions on the property. | Land | Improvement |
|---|---|---|---|---|
| 2025 | $1,625 | $11,001 | $2,993 | $8,008 |
| 2024 | $1,625 | $11,001 | $2,993 | $8,008 |
| 2023 | $1,563 | $11,001 | $2,363 | $8,638 |
| 2022 | $1,563 | $11,001 | $2,363 | $8,638 |
| 2021 | $1,546 | $10,999 | $2,362 | $8,637 |
| 2020 | $1,036 | $7,743 | $2,362 | $5,381 |
| 2019 | $1,023 | $8,509 | $2,362 | $6,147 |
| 2018 | $1,005 | $8,509 | $2,362 | $6,147 |
| 2017 | $1,697 | $11,243 | $2,047 | $9,196 |
| 2016 | $1,756 | $11,243 | $2,047 | $9,196 |
| 2015 | $1,830 | $12,586 | $2,047 | $10,539 |
| 2014 | $2,191 | $14,348 | $1,890 | $12,458 |
| 2013 | $2,136 | $14,348 | $1,890 | $12,458 |
Source: Public Records
Map
Nearby Homes
- 9100 S Wallace St
- 9118 S Wallace St
- 9117 S Wallace St
- 9100 S Emerald Ave
- 9019 S Normal Ave
- 9146 S Eggleston Ave
- 9207 S Halsted St
- 9115 S Green St
- 8856 S Parnell Ave
- 8900 S Normal Ave
- 9254 S Parnell Ave
- 9238 S Normal Ave
- 9240 S Normal Ave
- 8851 S Parnell Ave
- 8853 S Halsted St
- 8816 S Union Ave
- 8948 S Vincennes Ave
- 9407 S Normal Ave
- 9426 S Lowe Ave
- 9318 S Peoria St
- 9059 S Lowe Ave
- 9059 S Lowe Ave
- 9053 S Lowe Ave
- 9049 S Lowe Ave
- 9047 S Lowe Ave Unit 49
- 9047 S Lowe Ave Unit 49
- 9047 S Lowe Ave
- 9063 S Lowe Ave
- 9045 S Lowe Ave
- 9043 S Lowe Ave
- 9054 S Wallace St
- 9056 S Wallace St
- 9056 S Wallace St
- 9050 S Wallace St
- 9041 S Lowe Ave
- 9046 S Wallace St
- 9046 S Wallace St
- 9060 S Wallace St
- 9060 S Wallace St
- 9101 S Lowe Ave
Your Personal Tour Guide
Ask me questions while you tour the home.