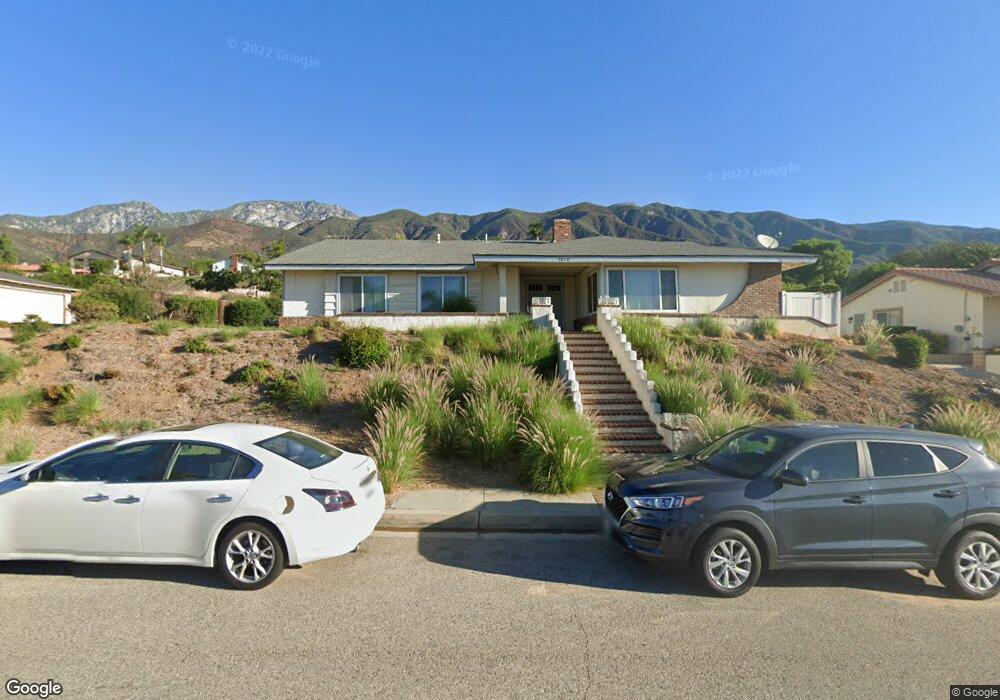
9058 Appaloosa Ct Rancho Cucamonga, CA 91737
Alta Loma NeighborhoodEstimated Value: $1,005,390 - $1,239,000
4
Beds
3
Baths
2,346
Sq Ft
$491/Sq Ft
Est. Value
About This Home
This home is located at 9058 Appaloosa Ct, Rancho Cucamonga, CA 91737 and is currently estimated at $1,152,348, approximately $491 per square foot. 9058 Appaloosa Ct is a home located in San Bernardino County with nearby schools including Floyd M. Stork Elementary, Alta Loma Junior High, and Los Osos High.
Ownership History
Date
Name
Owned For
Owner Type
Purchase Details
Closed on
Sep 21, 2021
Sold by
Meza Timothy M and Meza Sheryl A
Bought by
Meza Family Revocable Trust and Meza
Current Estimated Value
Purchase Details
Closed on
Sep 28, 2000
Sold by
Moreno Carmen
Bought by
Meza Timothy M and Meza Sheryl A
Home Financials for this Owner
Home Financials are based on the most recent Mortgage that was taken out on this home.
Original Mortgage
$256,500
Interest Rate
7.89%
Purchase Details
Closed on
Feb 17, 2000
Sold by
Nasca Dominic J and Nasca Jo Ann
Bought by
Moreno Carmen
Home Financials for this Owner
Home Financials are based on the most recent Mortgage that was taken out on this home.
Original Mortgage
$233,100
Interest Rate
8.38%
Create a Home Valuation Report for This Property
The Home Valuation Report is an in-depth analysis detailing your home's value as well as a comparison with similar homes in the area
Home Values in the Area
Average Home Value in this Area
Purchase History
| Date | Buyer | Sale Price | Title Company |
|---|---|---|---|
| Meza Family Revocable Trust | -- | Gaudy Jason | |
| Meza Timothy M | $285,000 | Benefit Land Title Company | |
| Moreno Carmen | $259,000 | Old Republic Title Company |
Source: Public Records
Mortgage History
| Date | Status | Borrower | Loan Amount |
|---|---|---|---|
| Previous Owner | Meza Timothy M | $256,500 | |
| Previous Owner | Moreno Carmen | $233,100 |
Source: Public Records
Tax History
| Year | Tax Paid | Tax Assessment Tax Assessment Total Assessment is a certain percentage of the fair market value that is determined by local assessors to be the total taxable value of land and additions on the property. | Land | Improvement |
|---|---|---|---|---|
| 2025 | $4,702 | $429,452 | $150,308 | $279,144 |
| 2024 | $4,583 | $421,032 | $147,361 | $273,671 |
| 2023 | $4,478 | $412,777 | $144,472 | $268,305 |
| 2022 | $4,543 | $404,683 | $141,639 | $263,044 |
| 2021 | $4,462 | $396,748 | $138,862 | $257,886 |
| 2020 | $4,278 | $392,680 | $137,438 | $255,242 |
| 2019 | $4,326 | $384,980 | $134,743 | $250,237 |
| 2018 | $4,227 | $377,431 | $132,101 | $245,330 |
| 2017 | $4,033 | $370,031 | $129,511 | $240,520 |
| 2016 | $3,922 | $362,776 | $126,972 | $235,804 |
| 2015 | $3,897 | $357,327 | $125,065 | $232,262 |
| 2014 | $3,785 | $350,327 | $122,615 | $227,712 |
Source: Public Records
Map
Nearby Homes
- 9111 Hidden Farm Rd
- 9149 Whirlaway Ct
- 9220 Camellia Ct
- 9227 Camellia Ct
- 9201 Camellia Ct
- 9209 Camellia Ct
- 9210 Camellia Ct
- 9230 Camellia Ct
- 9219 Camellia Ct
- 9239 Camellia Ct
- 8979 Camellia Ct
- 8798 Justify Dr
- 5291 Carnelian St
- 8851 Beechwood Dr
- 5836 Buckthorn Ave
- 9620 Hidden Farm Rd
- 5848 Burlwood Ct
- 0 Bella Vista Dr Unit CV25069957
- 4946 Jadeite Ave
- 8607 Buggy Whip Rd
- 9044 Appaloosa Ct
- 9072 Appaloosa Ct
- 9030 Appaloosa Ct
- 9086 Appaloosa Ct
- 9059 Citation Ct
- 9045 Citation Ct
- 9073 Citation Ct
- 9065 Appaloosa Ct
- 9051 Appaloosa Ct
- 9031 Citation Ct
- 9079 Appaloosa Ct
- 9087 Citation Ct
- 9016 Appaloosa Ct
- 9037 Appaloosa Ct
- 9017 Citation Ct
- 9087 Appaloosa Ct
- 9023 Appaloosa Ct
- 9111 Carrari Ct
- 9002 Appaloosa Ct
- 9003 Citation Ct
Your Personal Tour Guide
Ask me questions while you tour the home.