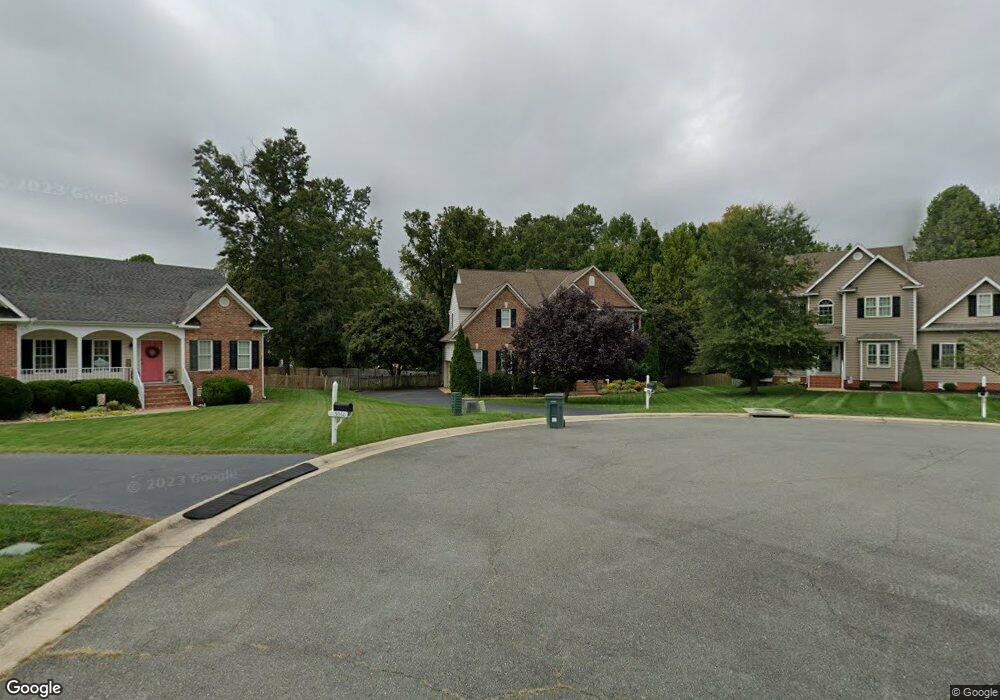
9058 Old Springfield Rd Glen Allen, VA 23060
Echo Lake NeighborhoodEstimated Value: $658,000 - $731,000
5
Beds
3
Baths
3,109
Sq Ft
$223/Sq Ft
Est. Value
About This Home
This home is located at 9058 Old Springfield Rd, Glen Allen, VA 23060 and is currently estimated at $692,451, approximately $222 per square foot. 9058 Old Springfield Rd is a home located in Henrico County with nearby schools including Echo Lake Elementary School, Hungary Creek Middle School, and Glen Allen High School.
Ownership History
Date
Name
Owned For
Owner Type
Purchase Details
Closed on
Jan 27, 2009
Sold by
Mckee Joshua C
Bought by
Mccauley Brian W
Current Estimated Value
Home Financials for this Owner
Home Financials are based on the most recent Mortgage that was taken out on this home.
Original Mortgage
$401,149
Outstanding Balance
$254,928
Interest Rate
5.2%
Mortgage Type
FHA
Estimated Equity
$437,523
Purchase Details
Closed on
Jan 13, 2006
Sold by
Austin & Hamlin Homes Inc
Bought by
Mckee Joshua C
Home Financials for this Owner
Home Financials are based on the most recent Mortgage that was taken out on this home.
Original Mortgage
$225,500
Interest Rate
6.33%
Mortgage Type
New Conventional
Purchase Details
Closed on
Mar 24, 2005
Sold by
Carrington West L L C
Bought by
Austin Hamlin Homes Inc
Create a Home Valuation Report for This Property
The Home Valuation Report is an in-depth analysis detailing your home's value as well as a comparison with similar homes in the area
Home Values in the Area
Average Home Value in this Area
Purchase History
| Date | Buyer | Sale Price | Title Company |
|---|---|---|---|
| Mccauley Brian W | $415,000 | -- | |
| Mckee Joshua C | $425,500 | -- | |
| Austin Hamlin Homes Inc | $75,725 | -- |
Source: Public Records
Mortgage History
| Date | Status | Borrower | Loan Amount |
|---|---|---|---|
| Open | Mccauley Brian W | $401,149 | |
| Previous Owner | Mckee Joshua C | $225,500 |
Source: Public Records
Tax History Compared to Growth
Tax History
| Year | Tax Paid | Tax Assessment Tax Assessment Total Assessment is a certain percentage of the fair market value that is determined by local assessors to be the total taxable value of land and additions on the property. | Land | Improvement |
|---|---|---|---|---|
| 2025 | $5,008 | $585,600 | $145,000 | $440,600 |
| 2024 | $5,008 | $514,300 | $135,000 | $379,300 |
| 2023 | $4,372 | $514,300 | $135,000 | $379,300 |
| 2022 | $3,975 | $467,700 | $115,000 | $352,700 |
| 2021 | $3,600 | $399,700 | $95,000 | $304,700 |
| 2020 | $3,477 | $399,700 | $95,000 | $304,700 |
| 2019 | $3,403 | $391,200 | $95,000 | $296,200 |
| 2018 | $3,403 | $391,200 | $95,000 | $296,200 |
| 2017 | $3,281 | $377,100 | $95,000 | $282,100 |
| 2016 | $3,281 | $377,100 | $95,000 | $282,100 |
| 2015 | $3,182 | $377,100 | $95,000 | $282,100 |
| 2014 | $3,182 | $365,800 | $95,000 | $270,800 |
Source: Public Records
Map
Nearby Homes
- 11213 Carrington Green Dr
- 9104 Rigney Terrace
- 5144 Hart Mill Dr
- 5929 Moriano Terrace
- 5124 Old Forester Ln
- 3117 Abruzzo Place
- 3948 Mountain Rd
- 2915 Murano Way
- 111 Siena Ln
- 9000 Castle Point Dr
- 8936 Castle Point Dr
- 5216 Reids Pointe Rd
- 5505 Kimbermere Ct
- 9324 Crystal Brook Terrace
- 9626 Wendhurst Dr
- 9746 Southmill Dr
- 10717 Smith Point Way
- 10732 Chase Grove Ln
- 463 Burden Dr
- 8041 Lake Laurel Ln Unit B
- 9062 Old Springfield Rd
- 9054 Old Springfield Rd
- 9109 Carrington Hills Ct
- 5833 Dorton Ln
- 9113 Carrington Hills Ct
- 5837 Dorton Ln
- 5829 Dorton Ln
- 9066 Old Springfield Rd
- 9050 Old Springfield Rd
- 9105 Carrington Hills Ct
- 5825 Dorton Ln
- 5841 Dorton Ln
- 9070 Old Springfield Rd
- 6004 Carrington Green Place
- 6008 Carrington Green Place
- 9112 Carrington Hills Ct
- 9101 Carrington Hills Ct
- 6012 Carrington Green Place
- 11100 Redmond Place
- 5845 Dorton Ln