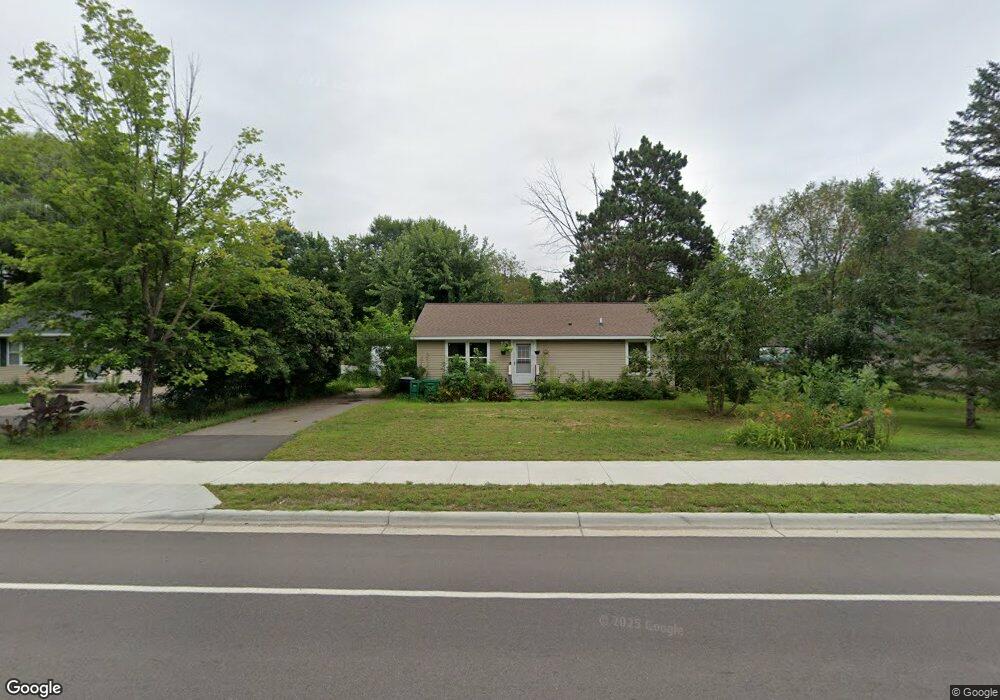
906 7th Ave N Princeton, MN 55371
Estimated Value: $237,000 - $265,336
1
Bed
1
Bath
960
Sq Ft
$261/Sq Ft
Est. Value
About This Home
This home is located at 906 7th Ave N, Princeton, MN 55371 and is currently estimated at $250,334, approximately $260 per square foot. 906 7th Ave N is a home located in Mille Lacs County with nearby schools including Princeton Intermediate School, Princeton Primary School, and Princeton Middle School.
Ownership History
Date
Name
Owned For
Owner Type
Purchase Details
Closed on
Feb 4, 2021
Sold by
Snelton Linda R
Bought by
Snelton Linda R and Gulbrandson Daniel
Current Estimated Value
Purchase Details
Closed on
Sep 16, 2008
Sold by
Beneficial Loan & Thrift Co
Bought by
Gulbrandson Bruce C
Home Financials for this Owner
Home Financials are based on the most recent Mortgage that was taken out on this home.
Original Mortgage
$73,800
Interest Rate
6.43%
Mortgage Type
New Conventional
Purchase Details
Closed on
May 29, 2008
Sold by
Moore Deborah M and Moore Gary
Bought by
Beneficial Loan And Thrift Company
Create a Home Valuation Report for This Property
The Home Valuation Report is an in-depth analysis detailing your home's value as well as a comparison with similar homes in the area
Home Values in the Area
Average Home Value in this Area
Purchase History
| Date | Buyer | Sale Price | Title Company |
|---|---|---|---|
| Snelton Linda R | -- | None Listed On Document | |
| Gulbrandson Bruce C | $82,000 | First Financial Title Agency | |
| Beneficial Loan And Thrift Company | -- | None Available |
Source: Public Records
Mortgage History
| Date | Status | Borrower | Loan Amount |
|---|---|---|---|
| Previous Owner | Gulbrandson Bruce C | $73,800 |
Source: Public Records
Tax History Compared to Growth
Tax History
| Year | Tax Paid | Tax Assessment Tax Assessment Total Assessment is a certain percentage of the fair market value that is determined by local assessors to be the total taxable value of land and additions on the property. | Land | Improvement |
|---|---|---|---|---|
| 2025 | $3,242 | $246,100 | $50,000 | $196,100 |
| 2024 | $5,144 | $234,100 | $50,000 | $184,100 |
| 2023 | $3,412 | $244,000 | $34,000 | $210,000 |
| 2022 | $2,928 | $239,500 | $34,000 | $205,500 |
| 2021 | $2,646 | $182,900 | $34,000 | $148,900 |
| 2020 | $624 | $171,000 | $19,100 | $151,900 |
| 2019 | $1,860 | $32,900 | $19,100 | $13,800 |
| 2018 | $1,706 | $122,500 | $19,100 | $103,400 |
| 2017 | $1,546 | $113,500 | $18,500 | $95,000 |
| 2016 | $1,438 | $0 | $0 | $0 |
| 2015 | $1,272 | $0 | $0 | $0 |
| 2014 | $1,272 | $0 | $0 | $0 |
Source: Public Records
Map
Nearby Homes