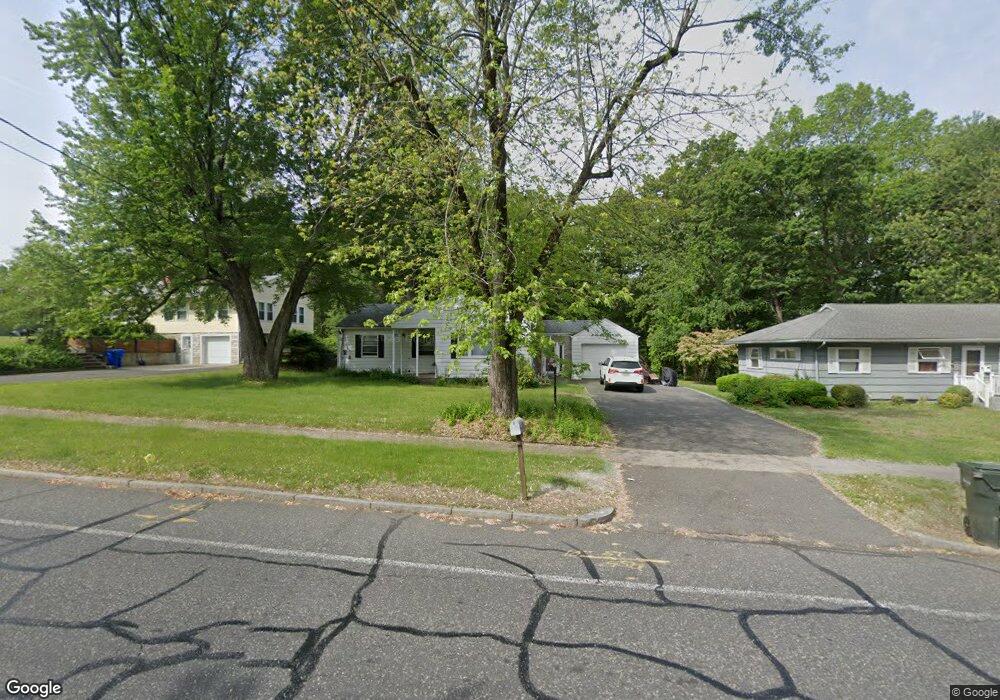
906 Bradley Rd Springfield, MA 01109
Sixteen Acres NeighborhoodEstimated Value: $292,000 - $319,719
3
Beds
1
Bath
1,056
Sq Ft
$291/Sq Ft
Est. Value
About This Home
This home is located at 906 Bradley Rd, Springfield, MA 01109 and is currently estimated at $307,680, approximately $291 per square foot. 906 Bradley Rd is a home located in Hampden County with nearby schools including Frank H. Freedman School, John J Duggan Middle, and Springfield High School of Science and Technology.
Ownership History
Date
Name
Owned For
Owner Type
Purchase Details
Closed on
Oct 23, 2009
Sold by
Benoit Lori and Benoit Clarence A
Bought by
Sueiras Zolaika
Current Estimated Value
Home Financials for this Owner
Home Financials are based on the most recent Mortgage that was taken out on this home.
Original Mortgage
$133,860
Outstanding Balance
$86,742
Interest Rate
5.09%
Mortgage Type
Purchase Money Mortgage
Estimated Equity
$220,938
Create a Home Valuation Report for This Property
The Home Valuation Report is an in-depth analysis detailing your home's value as well as a comparison with similar homes in the area
Home Values in the Area
Average Home Value in this Area
Purchase History
| Date | Buyer | Sale Price | Title Company |
|---|---|---|---|
| Sueiras Zolaika | $138,000 | -- |
Source: Public Records
Mortgage History
| Date | Status | Borrower | Loan Amount |
|---|---|---|---|
| Open | Sueiras Zolaika | $133,860 |
Source: Public Records
Tax History
| Year | Tax Paid | Tax Assessment Tax Assessment Total Assessment is a certain percentage of the fair market value that is determined by local assessors to be the total taxable value of land and additions on the property. | Land | Improvement |
|---|---|---|---|---|
| 2025 | $3,878 | $247,300 | $58,200 | $189,100 |
| 2024 | $3,700 | $230,400 | $58,200 | $172,200 |
| 2023 | $3,586 | $210,300 | $55,400 | $154,900 |
| 2022 | $3,393 | $180,300 | $55,400 | $124,900 |
| 2021 | $3,175 | $168,000 | $50,300 | $117,700 |
| 2020 | $3,090 | $158,200 | $50,300 | $107,900 |
| 2019 | $3,058 | $155,400 | $50,300 | $105,100 |
| 2018 | $2,842 | $144,400 | $50,300 | $94,100 |
| 2017 | $2,853 | $145,100 | $55,300 | $89,800 |
| 2016 | $2,707 | $137,700 | $55,300 | $82,400 |
| 2015 | $2,679 | $136,200 | $55,300 | $80,900 |
Source: Public Records
Map
Nearby Homes
- 11 Cheyenne Rd
- 74 Valley Rd
- 290 Newton Rd
- 27 Regal St
- 37 Chesterfield Ave
- 101 Regal St
- 56 Pennsylvania Ave
- 120 Bridle Path Rd
- 231 Dayton St
- 384 Abbott St
- 865 S Branch Pkwy
- 54 S Shore Dr
- 81 W Crystal Brook Dr
- 944 Wilbraham Rd
- 108 Birchland Ave
- 86 Wildwood Ave
- 63 Lawton St
- 1201 Allen St
- 55 Allen St
- 18 Lawton St