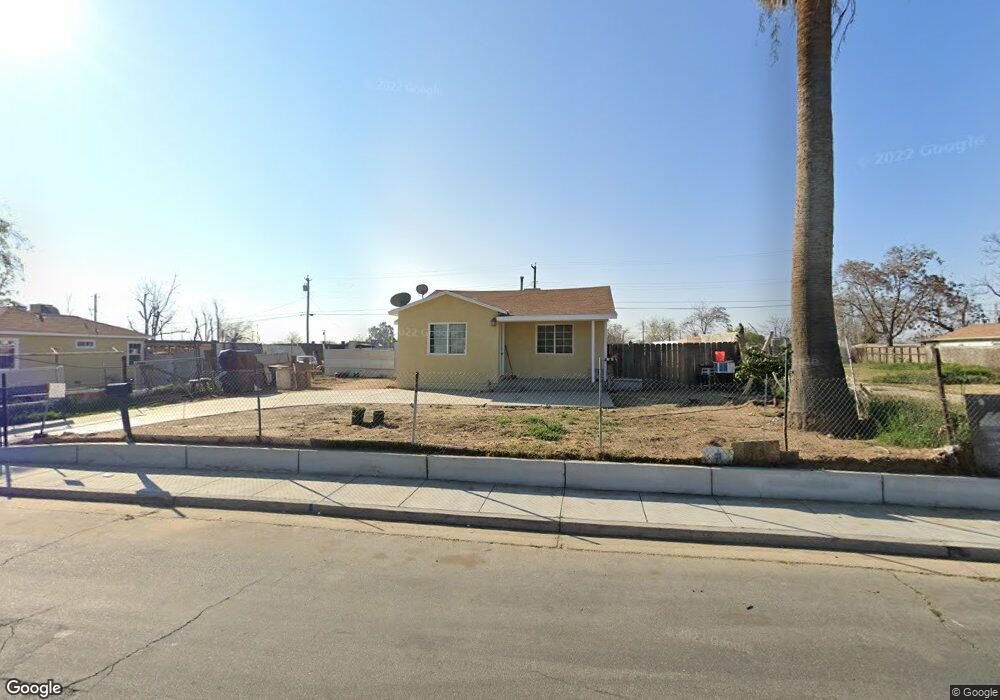
906 Bradshaw St Bakersfield, CA 93307
Estimated Value: $188,000 - $208,000
2
Beds
1
Bath
866
Sq Ft
$227/Sq Ft
Est. Value
About This Home
This home is located at 906 Bradshaw St, Bakersfield, CA 93307 and is currently estimated at $196,337, approximately $226 per square foot. 906 Bradshaw St is a home located in Kern County with nearby schools including Casa Loma Elementary School, Sequoia Middle School, and Mira Monte High School.
Ownership History
Date
Name
Owned For
Owner Type
Purchase Details
Closed on
Apr 26, 2025
Sold by
Aldaco Angel and Aldaco Elena
Bought by
Aldaco Family Revocable Trust and Aldaco
Current Estimated Value
Purchase Details
Closed on
Nov 10, 2014
Sold by
Ross Earle John P and Ross Earle Barbara
Bought by
Aldaco Angel and Aldaco Elena
Purchase Details
Closed on
Jun 25, 2014
Sold by
Earle Barbara Ross
Bought by
Ross Earle John P and Ross Earle Barbara
Purchase Details
Closed on
Jun 3, 2011
Sold by
Laba Lynore
Bought by
Laba Lynore and The Lynore Laba Revocable Livi
Purchase Details
Closed on
Aug 19, 2009
Sold by
Ross Charles A and Ross Family Trust
Bought by
Ross Ross Charles A Charles A and Ross Earle Barbara Ellen
Purchase Details
Closed on
Oct 4, 1999
Sold by
Laba David and Laba Eleanor G
Bought by
Laba David and David & Eleanor Laba Living Tr
Create a Home Valuation Report for This Property
The Home Valuation Report is an in-depth analysis detailing your home's value as well as a comparison with similar homes in the area
Purchase History
| Date | Buyer | Sale Price | Title Company |
|---|---|---|---|
| Aldaco Family Revocable Trust | -- | None Listed On Document | |
| Aldaco Angel | $54,000 | Placer Title Company | |
| Ross Earle John P | -- | None Available | |
| Earle Barbara Ross | -- | None Available | |
| Laba Lynore | -- | None Available | |
| Laba Lynore | -- | None Available | |
| Ross Ross Charles A Charles A | -- | None Available | |
| Laba David | -- | -- |
Source: Public Records
Tax History
| Year | Tax Paid | Tax Assessment Tax Assessment Total Assessment is a certain percentage of the fair market value that is determined by local assessors to be the total taxable value of land and additions on the property. | Land | Improvement |
|---|---|---|---|---|
| 2025 | $1,456 | $64,892 | $24,033 | $40,859 |
| 2024 | $1,456 | $63,620 | $23,562 | $40,058 |
| 2023 | $1,419 | $62,373 | $23,100 | $39,273 |
| 2022 | $1,372 | $61,151 | $22,648 | $38,503 |
| 2021 | $1,275 | $59,953 | $22,204 | $37,749 |
| 2020 | $1,240 | $59,339 | $21,977 | $37,362 |
| 2019 | $1,217 | $59,339 | $21,977 | $37,362 |
| 2018 | $1,192 | $57,037 | $21,125 | $35,912 |
| 2017 | $1,183 | $55,919 | $20,711 | $35,208 |
| 2016 | $1,109 | $54,823 | $20,305 | $34,518 |
| 2015 | $1,097 | $54,000 | $20,000 | $34,000 |
| 2014 | $578 | $9,475 | $2,265 | $7,210 |
Source: Public Records
Map
Nearby Homes
- 2329 Watts Dr
- 1011 Casa Grande St
- 3517 Lotus Ln
- 2419 Cottonwood Rd
- 1420 Reese Ave
- 900 E Planz Rd
- 0 E Planz Rd
- 1303 Erie St
- 3308 Hale St
- 3501 Oliver St
- 3621 Oliver St
- 3604 Elda Ave
- 1134 Lomita Dr
- 2101 E Belle Terrace
- 2320 Michael St
- 1213 Feliz Dr
- 1012 Feliz Dr
- 305 Madison St
- 1001 Padre St
- 600 Lawson Rd
- 904 Bradshaw St
- 910 Bradshaw St
- 805 Bradshaw St
- 902 Bradshaw St
- 912 Bradshaw St
- 909 Melwood St
- 907 Melwood St
- 914 Bradshaw St
- 905 Melwood St
- 913 Melwood St
- 814 Bradshaw St
- 1000 Bradshaw St
- 903 Bradshaw St
- 915 Melwood St
- 901 Bradshaw St
- 817 Melwood St
- 815 Melwood St
- 812 Bradshaw St
- 1002 Bradshaw St
- 1001 Melwood St
Your Personal Tour Guide
Ask me questions while you tour the home.