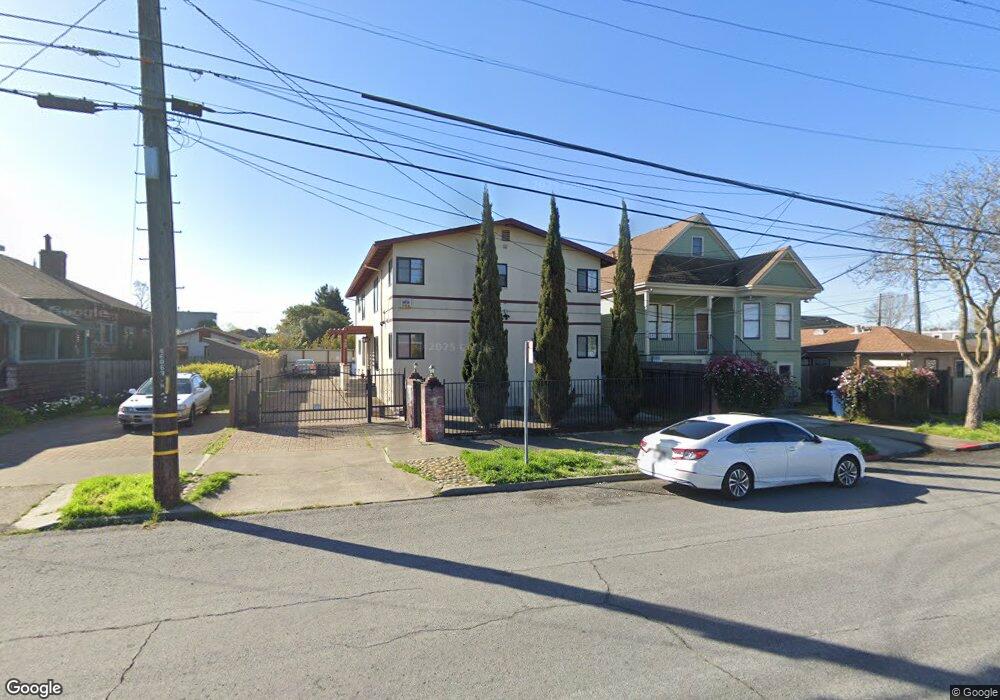
906 Delaware St Berkeley, CA 94710
West Berkeley NeighborhoodEstimated Value: $1,023,767 - $1,737,000
8
Beds
4
Baths
3,152
Sq Ft
$458/Sq Ft
Est. Value
About This Home
This home is located at 906 Delaware St, Berkeley, CA 94710 and is currently estimated at $1,444,192, approximately $458 per square foot. 906 Delaware St is a home located in Alameda County with nearby schools including Rosa Parks Elementary School, Ruth Acty Elementary, and Berkeley Arts Magnet at Whittier School.
Ownership History
Date
Name
Owned For
Owner Type
Purchase Details
Closed on
Feb 4, 2021
Sold by
Lydia Y Wong Trust and The Lydia Y Wong Trust
Bought by
Sabrina Wong 2019 Irrevocable Trust and Wang
Current Estimated Value
Purchase Details
Closed on
Aug 24, 2017
Sold by
Wong Lydia Y
Bought by
Wong Lydia Y and The Lydia Y Wong Trust
Purchase Details
Closed on
Dec 1, 1995
Sold by
Ben Shalom Moshe and Myzel Eyal
Bought by
Wong Tony Y and Wong Lydia Y
Home Financials for this Owner
Home Financials are based on the most recent Mortgage that was taken out on this home.
Original Mortgage
$169,000
Interest Rate
7.48%
Create a Home Valuation Report for This Property
The Home Valuation Report is an in-depth analysis detailing your home's value as well as a comparison with similar homes in the area
Home Values in the Area
Average Home Value in this Area
Purchase History
| Date | Buyer | Sale Price | Title Company |
|---|---|---|---|
| Sabrina Wong 2019 Irrevocable Trust | -- | None Listed On Document | |
| Wong Lydia Y | -- | None Available | |
| Wong Tony Y | $260,000 | Fidelity National Title Ins |
Source: Public Records
Mortgage History
| Date | Status | Borrower | Loan Amount |
|---|---|---|---|
| Previous Owner | Wong Tony Y | $169,000 |
Source: Public Records
Tax History
| Year | Tax Paid | Tax Assessment Tax Assessment Total Assessment is a certain percentage of the fair market value that is determined by local assessors to be the total taxable value of land and additions on the property. | Land | Improvement |
|---|---|---|---|---|
| 2025 | $10,787 | $431,901 | $129,570 | $302,331 |
| 2024 | $10,787 | $423,433 | $127,030 | $296,403 |
| 2023 | $10,521 | $415,131 | $124,539 | $290,592 |
| 2022 | $10,234 | $406,993 | $122,098 | $284,895 |
| 2021 | $10,191 | $399,013 | $119,704 | $279,309 |
| 2020 | $9,392 | $394,924 | $118,477 | $276,447 |
| 2019 | $8,748 | $387,181 | $116,154 | $271,027 |
| 2018 | $8,545 | $379,591 | $113,877 | $265,714 |
| 2017 | $8,217 | $372,150 | $111,645 | $260,505 |
| 2016 | $7,775 | $364,854 | $109,456 | $255,398 |
| 2015 | $7,648 | $359,377 | $107,813 | $251,564 |
| 2014 | $7,792 | $352,338 | $105,701 | $246,637 |
Source: Public Records
Map
Nearby Homes
- 940 Delaware St
- 817 Delaware St
- 995 Virginia St
- 2013 9th St
- 1128 Delaware St
- 1050 Allston Way
- 1728 Curtis St
- 921 Jones St
- 1919 Curtis St
- 817 Jones St
- 2220 7th St
- 2238 7th St
- 1261 Hearst Ave
- 2241 Ninth St
- 931 Bancroft Way
- 2144 Curtis St
- 1450 Fourth St Unit 5
- 1631 Belvedere Ave
- 2231 Byron St
- 1322 Virginia St
Your Personal Tour Guide
Ask me questions while you tour the home.