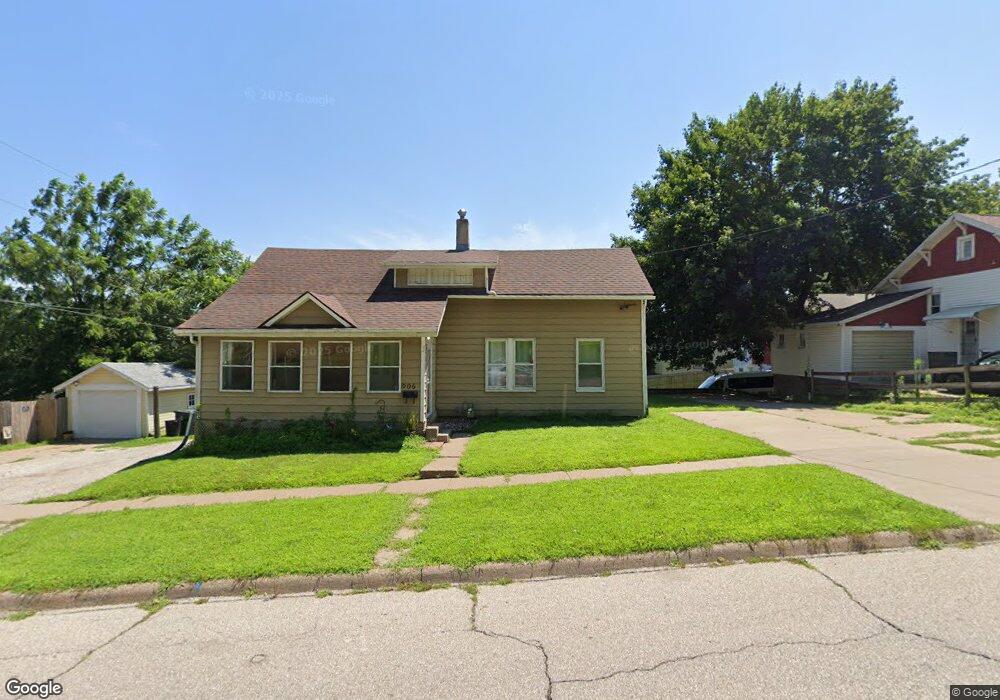
906 E 11th St Muscatine, IA 52761
Estimated Value: $114,000 - $129,601
2
Beds
1
Bath
938
Sq Ft
$130/Sq Ft
Est. Value
About This Home
This home is located at 906 E 11th St, Muscatine, IA 52761 and is currently estimated at $122,400, approximately $130 per square foot. 906 E 11th St is a home located in Muscatine County with nearby schools including Jefferson Elementary School, Central Middle School, and Muscatine High School.
Ownership History
Date
Name
Owned For
Owner Type
Purchase Details
Closed on
May 20, 2021
Sold by
Npsw Enterprise Llc
Bought by
Martinez Alfonso R
Current Estimated Value
Purchase Details
Closed on
Oct 29, 2012
Sold by
Martinez Tereso Z and Martinez Margaret
Bought by
Xuniga J Jesus Martinez
Home Financials for this Owner
Home Financials are based on the most recent Mortgage that was taken out on this home.
Original Mortgage
$31,500
Interest Rate
3.4%
Mortgage Type
New Conventional
Create a Home Valuation Report for This Property
The Home Valuation Report is an in-depth analysis detailing your home's value as well as a comparison with similar homes in the area
Home Values in the Area
Average Home Value in this Area
Purchase History
| Date | Buyer | Sale Price | Title Company |
|---|---|---|---|
| Martinez Alfonso R | $35,000 | None Available | |
| Xuniga J Jesus Martinez | $49,500 | None Available |
Source: Public Records
Mortgage History
| Date | Status | Borrower | Loan Amount |
|---|---|---|---|
| Previous Owner | Xuniga J Jesus Martinez | $31,500 |
Source: Public Records
Tax History Compared to Growth
Tax History
| Year | Tax Paid | Tax Assessment Tax Assessment Total Assessment is a certain percentage of the fair market value that is determined by local assessors to be the total taxable value of land and additions on the property. | Land | Improvement |
|---|---|---|---|---|
| 2025 | $1,730 | $107,460 | $12,670 | $94,790 |
| 2024 | $1,730 | $105,670 | $12,670 | $93,000 |
| 2023 | $1,690 | $104,516 | $12,656 | $91,860 |
| 2022 | $1,586 | $92,870 | $11,940 | $80,930 |
| 2021 | $1,586 | $86,690 | $11,940 | $74,750 |
| 2020 | $1,512 | $80,800 | $10,200 | $70,600 |
| 2019 | $1,296 | $74,550 | $0 | $0 |
| 2018 | $620 | $74,370 | $0 | $0 |
| 2017 | $620 | $74,370 | $0 | $0 |
| 2016 | $682 | $74,370 | $0 | $0 |
| 2015 | $682 | $71,490 | $0 | $0 |
| 2014 | $628 | $71,490 | $0 | $0 |
Source: Public Records
Map
Nearby Homes