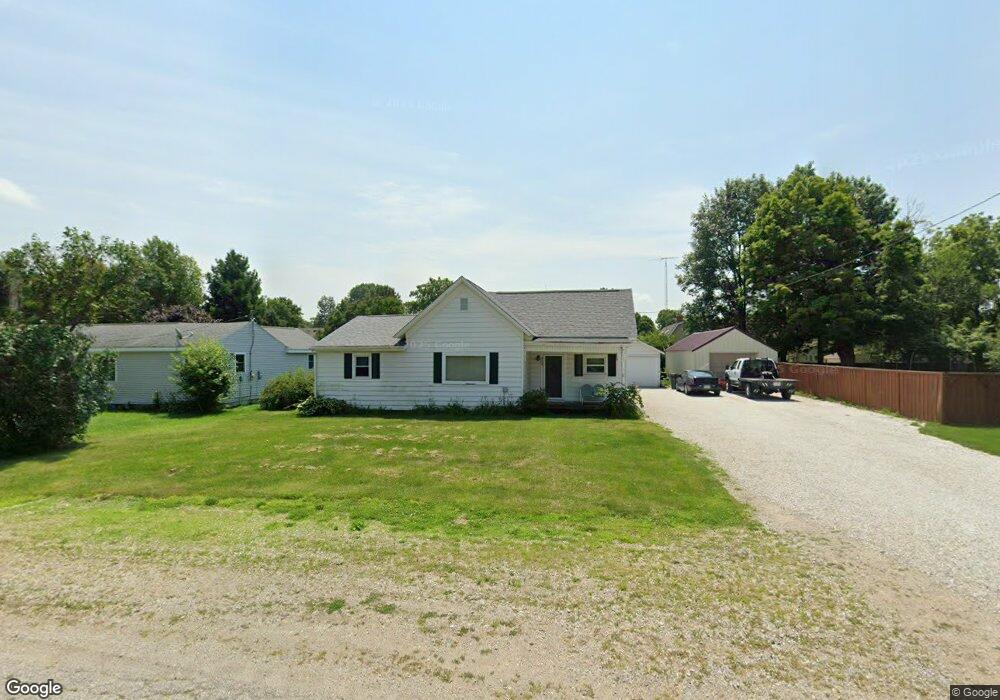
906 E 8th St Fowler, IN 47944
Estimated Value: $153,000 - $190,000
3
Beds
1
Bath
1,204
Sq Ft
$142/Sq Ft
Est. Value
About This Home
This home is located at 906 E 8th St, Fowler, IN 47944 and is currently estimated at $170,582, approximately $141 per square foot. 906 E 8th St is a home located in Benton County with nearby schools including Benton Central Junior/Senior High School and Sacred Heart Elementary School.
Ownership History
Date
Name
Owned For
Owner Type
Purchase Details
Closed on
Sep 7, 2012
Sold by
Schwartz Michael A
Bought by
Schwartz Brian E
Current Estimated Value
Home Financials for this Owner
Home Financials are based on the most recent Mortgage that was taken out on this home.
Original Mortgage
$61,734
Outstanding Balance
$41,991
Interest Rate
3.59%
Estimated Equity
$128,591
Purchase Details
Closed on
Sep 22, 2010
Sold by
B L Pritchett Benton Co Sheriff
Bought by
Federal Home Loan Mtg Corp
Create a Home Valuation Report for This Property
The Home Valuation Report is an in-depth analysis detailing your home's value as well as a comparison with similar homes in the area
Purchase History
| Date | Buyer | Sale Price | Title Company |
|---|---|---|---|
| Schwartz Brian E | $60,500 | -- | |
| Federal Home Loan Mtg Corp | $33,300 | -- |
Source: Public Records
Mortgage History
| Date | Status | Borrower | Loan Amount |
|---|---|---|---|
| Open | Schwartz Brian E | $61,734 |
Source: Public Records
Tax History
| Year | Tax Paid | Tax Assessment Tax Assessment Total Assessment is a certain percentage of the fair market value that is determined by local assessors to be the total taxable value of land and additions on the property. | Land | Improvement |
|---|---|---|---|---|
| 2025 | $1,080 | $106,400 | $9,200 | $97,200 |
| 2024 | $1,080 | $112,300 | $9,200 | $103,100 |
| 2023 | $883 | $98,900 | $8,300 | $90,600 |
| 2022 | $632 | $81,400 | $8,300 | $73,100 |
| 2021 | $478 | $66,600 | $8,300 | $58,300 |
| 2020 | $391 | $57,600 | $8,300 | $49,300 |
| 2019 | $378 | $60,200 | $7,900 | $52,300 |
| 2018 | $250 | $54,900 | $7,900 | $47,000 |
| 2017 | $331 | $54,000 | $7,900 | $46,100 |
| 2016 | $309 | $49,300 | $7,900 | $41,400 |
| 2014 | $276 | $44,400 | $7,800 | $36,600 |
| 2013 | $276 | $41,700 | $7,400 | $34,300 |
Source: Public Records
Map
Nearby Homes
- 902 E 8th St
- 909 E 8th St
- 201 S Grant Ave
- 700 S Sharon Ave
- 503 E 8th St
- 501 E 7th St
- 502 E 5th St
- 602 S Park Dr
- 1009 E 4th St
- 310 E 7th St
- 305 N Lincoln Ave
- 601 E 3rd St
- 303 N Jackson Ave
- 202 N Van Buren Ave
- 307 N Madison Ave
- 307 N Washington Ave
- 111 W 4th St
- 206 E Maple St
- 703 W 2nd St
- Lot 9 W 2nd St
Your Personal Tour Guide
Ask me questions while you tour the home.