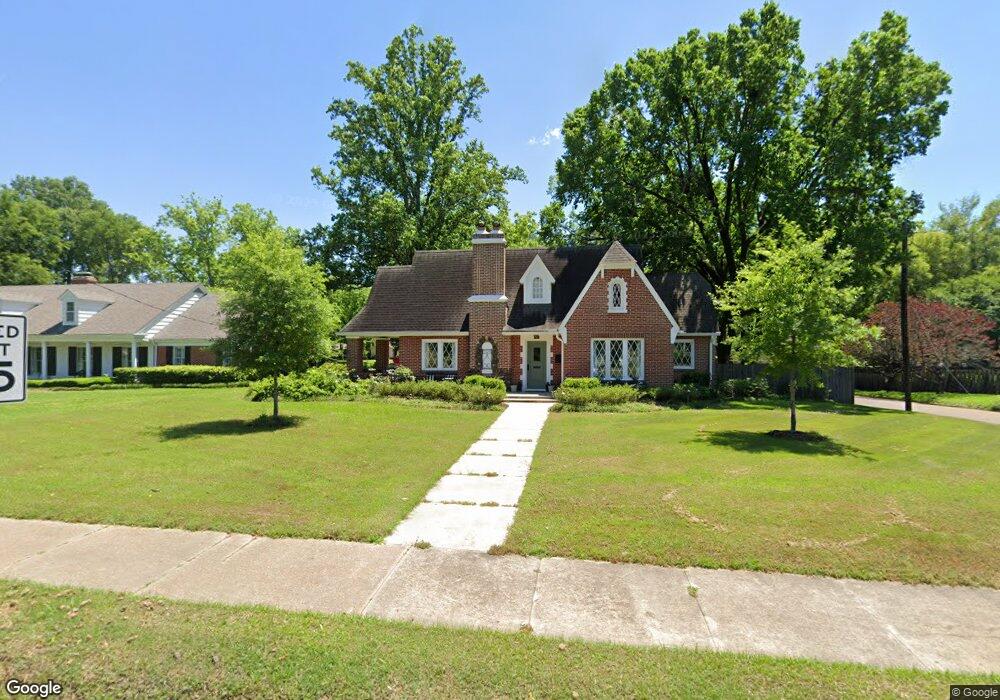
906 E Main St West Point, MS 39773
Estimated Value: $165,000 - $244,000
2
Beds
--
Bath
2,079
Sq Ft
$103/Sq Ft
Est. Value
About This Home
This home is located at 906 E Main St, West Point, MS 39773 and is currently estimated at $213,195, approximately $102 per square foot. 906 E Main St is a home located in Clay County with nearby schools including East Side Elementary School, West Clay Elementary School, and Church Hill Elementary School.
Ownership History
Date
Name
Owned For
Owner Type
Purchase Details
Closed on
Feb 10, 2021
Sold by
Abner Chelcie Jean and Ghoston Patrick
Bought by
Jameson John C
Current Estimated Value
Purchase Details
Closed on
Nov 4, 2009
Sold by
Rich Micheal V and Dahl Kathleen
Bought by
Ramsey Richard
Home Financials for this Owner
Home Financials are based on the most recent Mortgage that was taken out on this home.
Original Mortgage
$124,694
Interest Rate
5.01%
Create a Home Valuation Report for This Property
The Home Valuation Report is an in-depth analysis detailing your home's value as well as a comparison with similar homes in the area
Purchase History
| Date | Buyer | Sale Price | Title Company |
|---|---|---|---|
| Jameson John C | -- | -- | |
| Ramsey Richard | -- | -- |
Source: Public Records
Mortgage History
| Date | Status | Borrower | Loan Amount |
|---|---|---|---|
| Previous Owner | Ramsey Richard | $124,694 | |
| Previous Owner | Ramsey Richard | $124,694 |
Source: Public Records
Tax History
| Year | Tax Paid | Tax Assessment Tax Assessment Total Assessment is a certain percentage of the fair market value that is determined by local assessors to be the total taxable value of land and additions on the property. | Land | Improvement |
|---|---|---|---|---|
| 2025 | $782 | $17,185 | $3,330 | $13,855 |
| 2024 | $782 | $17,185 | $3,330 | $13,855 |
| 2023 | $1,816 | $14,137 | $3,330 | $10,807 |
| 2022 | $621 | $14,137 | $3,330 | $10,807 |
| 2021 | $615 | $14,137 | $3,330 | $10,807 |
| 2020 | $618 | $14,137 | $3,330 | $10,807 |
| 2019 | $629 | $15,174 | $3,330 | $11,844 |
| 2018 | $602 | $15,174 | $3,330 | $11,844 |
| 2017 | $1,128 | $22,760 | $4,995 | $17,765 |
| 2016 | $1,103 | $22,760 | $4,995 | $17,765 |
| 2015 | $542 | $13,984 | $3,330 | $10,654 |
| 2014 | $952 | $13,984 | $3,330 | $10,654 |
| 2013 | $952 | $13,984 | $3,330 | $10,654 |
Source: Public Records
Map
Nearby Homes
- 26596 E Main St
- 27045 E Main St
- 26852 E Main St
- 551 E Westbrook St
- 26788 E Main St
- 480 E Westbrook St
- 341 Mccord St
- 530 E Morrow St
- 238 Calhoun St
- 913 E Westbrook St
- 761 E Morrow St
- 228 Mccord St
- 123 Cottrell St
- 184 Tournament St
- 507 S Eshman Ave
- 105 Converse Dr
- 1046 E Brame Ave
- 472 S Eshman Ave
- 33 Court
- 405 S Eshman Ave
- 910 E Main St
- 846 E Main St
- 846 E Main St
- 26958 E Main St
- 26944 E Main St Unit 11
- 26944 E Main St Unit 6
- 26944 E Main St Unit 6 7 15
- 26944 E Main St Unit 7
- 909 E Main St
- 27038 E Main St
- 206 Mcclellan St
- 929 E Jordan Avenue Extension
- 207 Mcclellan St
- 919 E Main St
- 224 Mcclellan St
- 940 E Main St
- 790 Jordan Ave
- 928 E Jordan Avenue Extension
- 540 Mcclellan St
- 933 E Jordan Avenue Extension
Your Personal Tour Guide
Ask me questions while you tour the home.