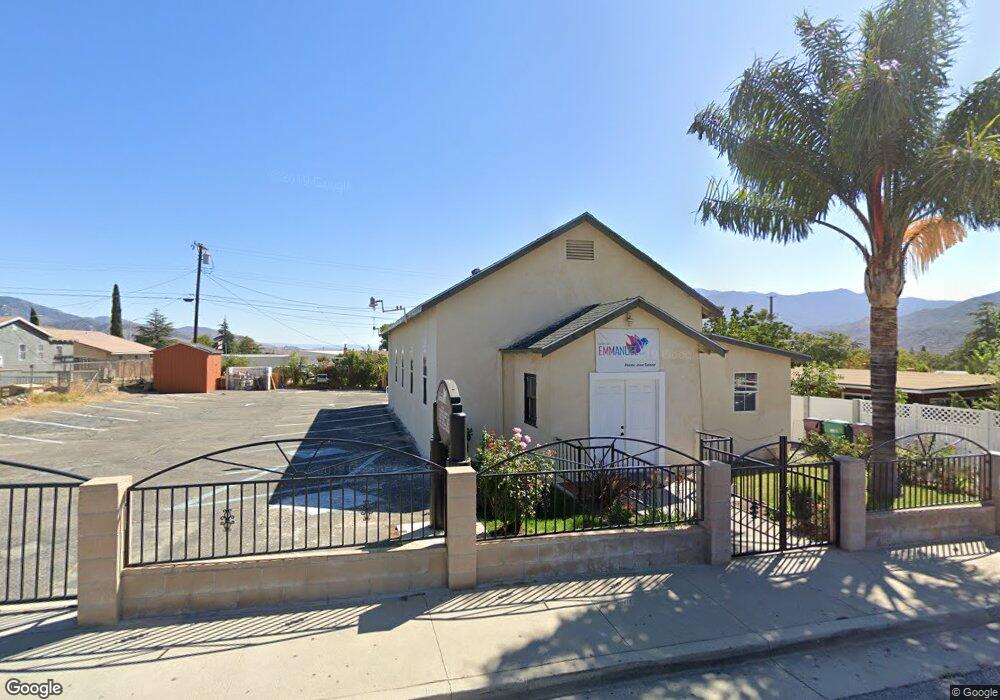
906 N Almond Way Banning, CA 92220
3
Beds
2
Baths
2,205
Sq Ft
0.28
Acres
About This Home
This home is located at 906 N Almond Way, Banning, CA 92220. 906 N Almond Way is a home located in Riverside County with nearby schools including Banning High School and Calvary Christian School.
Ownership History
Date
Name
Owned For
Owner Type
Purchase Details
Closed on
Oct 28, 2024
Sold by
Murillo Jose
Bought by
Southern Pacific Disctrict Council Of The Ass
Purchase Details
Closed on
Nov 4, 2022
Sold by
Lopez Rutilio
Bought by
Southern Pacific District Coun
Purchase Details
Closed on
Nov 23, 2019
Sold by
Santiago Cris
Bought by
Southern Pacific District Council Of The Asse
Purchase Details
Closed on
May 20, 2004
Sold by
Nilakout Xayphone
Bought by
Lopez Rutilio and Santiago Cris
Purchase Details
Closed on
Sep 9, 2002
Sold by
W D Burks Family Trust
Bought by
Nilakout Xayphone
Home Financials for this Owner
Home Financials are based on the most recent Mortgage that was taken out on this home.
Original Mortgage
$54,000
Interest Rate
6.17%
Mortgage Type
Seller Take Back
Purchase Details
Closed on
Jul 7, 1999
Sold by
Burks Webster D
Bought by
W D Burks Family Trust
Create a Home Valuation Report for This Property
The Home Valuation Report is an in-depth analysis detailing your home's value as well as a comparison with similar homes in the area
Home Values in the Area
Average Home Value in this Area
Purchase History
| Date | Buyer | Sale Price | Title Company |
|---|---|---|---|
| Southern Pacific Disctrict Council Of The Ass | -- | None Listed On Document | |
| Southern Pacific Disctrict Council Of The Ass | -- | None Listed On Document | |
| Southern Pacific District Coun | -- | None Listed On Document | |
| Southern Pacific District Council Of The Asse | -- | -- | |
| Lopez Rutilio | $100,000 | -- | |
| Nilakout Xayphone | $60,000 | First American Title Co | |
| W D Burks Family Trust | -- | -- |
Source: Public Records
Mortgage History
| Date | Status | Borrower | Loan Amount |
|---|---|---|---|
| Previous Owner | Nilakout Xayphone | $54,000 |
Source: Public Records
Tax History Compared to Growth
Tax History
| Year | Tax Paid | Tax Assessment Tax Assessment Total Assessment is a certain percentage of the fair market value that is determined by local assessors to be the total taxable value of land and additions on the property. | Land | Improvement |
|---|---|---|---|---|
| 2025 | $73 | $262,739 | $84,122 | $178,617 |
| 2023 | $73 | $136,637 | $27,318 | $109,319 |
| 2022 | $73 | $133,959 | $26,783 | $107,176 |
| 2021 | $73 | $131,333 | $26,258 | $105,075 |
| 2020 | $69 | $129,987 | $25,989 | $103,998 |
| 2019 | $69 | $127,437 | $25,479 | $101,958 |
| 2018 | $1,848 | $124,939 | $24,982 | $99,957 |
| 2017 | $1,818 | $122,491 | $24,493 | $97,998 |
| 2016 | $1,730 | $120,090 | $24,013 | $96,077 |
| 2015 | $1,706 | $118,288 | $23,653 | $94,635 |
| 2014 | $1,695 | $115,973 | $23,191 | $92,782 |
Source: Public Records
Map
Nearby Homes
- 0 N Almond Way Unit IG25103642
- 0 N Blanchard St
- 660 N Florida St
- 720 E George St
- 0 N Cherry St Unit CV23205173
- 755 N Allen St
- 1501 E Wilson St
- 1354 N Hermosa Ave
- 732 N Allen St
- 917 E Nicolet St Unit 157
- 625 E Theodore St
- 1508 N Almond Way
- 378 N Hargrave St
- 1010 E Nicolet St
- 230 E Hoffer St
- 0 E Williams St
- 1510 E Nicolet St
- 1225 N Alessandro St
- 245 N Evans St
- 0 E Hoffer St
- 884 N Almond Way
- 934 N Almond Way
- 2 N Almond Way
- 1 N Almond Way
- 0 N Almond Way
- 0 N Almond Way Unit CRIG25103642
- 0 N Almond Way Unit EV23187868
- 0 N Almond Way Unit SW21062098
- 0 N Almond Way Unit SW20179225
- 0 N Almond Way Unit EV20093312
- 0 N Almond Way Unit 21481427
- 905 N Blanchard St
- 868 N Almond Way
- 887 N Blanchard St
- 939 N Blanchard St
- 879 N Blanchard St
- 913 N Almond Way
- 899 N Almond Way
- 852 N Almond Way
- 937 N Almond Way