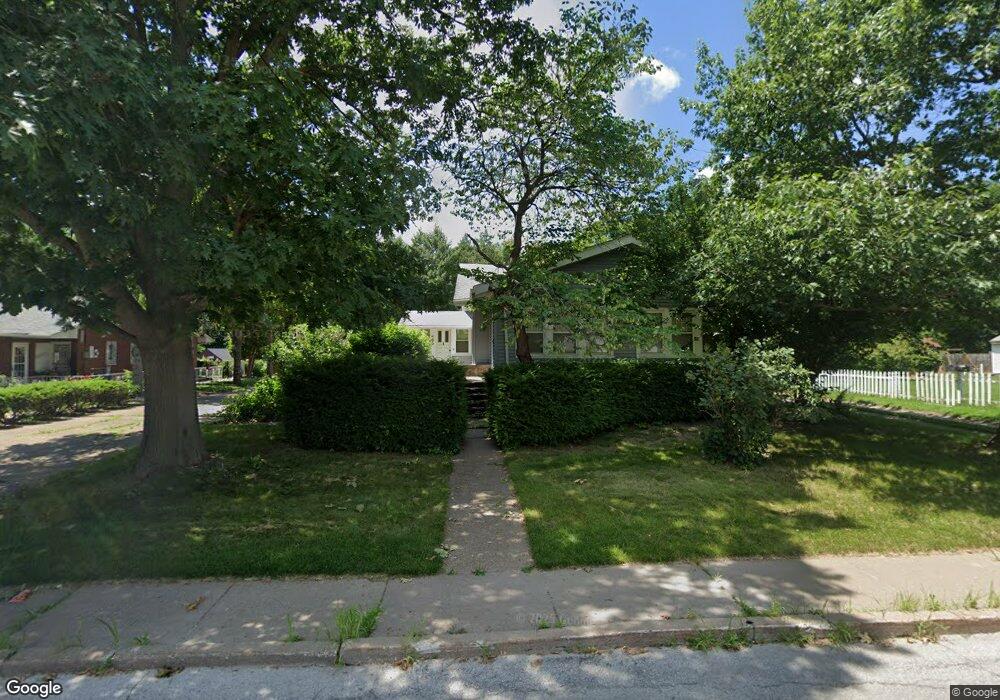
906 N Pine St Davenport, IA 52804
West End NeighborhoodEstimated Value: $201,000 - $224,068
4
Beds
2
Baths
1,763
Sq Ft
$119/Sq Ft
Est. Value
About This Home
This home is located at 906 N Pine St, Davenport, IA 52804 and is currently estimated at $209,267, approximately $118 per square foot. 906 N Pine St is a home located in Scott County with nearby schools including Walnut Hill Elementary School, South Christian Elementary School, and Wilson Elementary School.
Ownership History
Date
Name
Owned For
Owner Type
Purchase Details
Closed on
Mar 25, 2008
Sold by
The Bank Of New York Trust Na
Bought by
Wehr Joseph M
Current Estimated Value
Purchase Details
Closed on
Feb 13, 2008
Sold by
Schryver Pamela L
Bought by
Bank Of New York Trust Co Na and Jp Morgan Chase Bank Na
Purchase Details
Closed on
Dec 27, 2007
Sold by
Frazier Carl J and Frazier Janice A
Bought by
Sultan Harve and Sultan Chrystal
Create a Home Valuation Report for This Property
The Home Valuation Report is an in-depth analysis detailing your home's value as well as a comparison with similar homes in the area
Home Values in the Area
Average Home Value in this Area
Purchase History
| Date | Buyer | Sale Price | Title Company |
|---|---|---|---|
| Wehr Joseph M | $53,000 | None Available | |
| Bank Of New York Trust Co Na | $60,000 | None Available | |
| Sultan Harve | $148,000 | None Available |
Source: Public Records
Tax History Compared to Growth
Tax History
| Year | Tax Paid | Tax Assessment Tax Assessment Total Assessment is a certain percentage of the fair market value that is determined by local assessors to be the total taxable value of land and additions on the property. | Land | Improvement |
|---|---|---|---|---|
| 2025 | $2,528 | $188,940 | $26,740 | $162,200 |
| 2024 | $2,576 | $173,800 | $26,740 | $147,060 |
| 2023 | $3,374 | $173,800 | $26,740 | $147,060 |
| 2022 | $3,244 | $170,210 | $26,740 | $143,470 |
| 2021 | $3,244 | $163,510 | $26,740 | $136,770 |
| 2020 | $2,838 | $158,140 | $26,740 | $131,400 |
| 2019 | $2,860 | $139,240 | $26,740 | $112,500 |
| 2018 | $2,664 | $139,240 | $26,740 | $112,500 |
| 2017 | $723 | $133,320 | $26,740 | $106,580 |
| 2016 | $2,656 | $133,320 | $0 | $0 |
| 2015 | $2,656 | $134,890 | $0 | $0 |
| 2014 | $2,728 | $134,890 | $0 | $0 |
| 2013 | $2,676 | $0 | $0 | $0 |
| 2012 | -- | $149,960 | $28,750 | $121,210 |
Source: Public Records
Map
Nearby Homes
- 926 Cimarron Dr
- 2114 Telegraph Rd
- 2024 W 6th St
- 2101 W 5th St
- 1107 N Thornwood Ave
- 511 Waverly Rd
- 1119 N Thornwood Ave
- 1203 N Thornwood Ave
- 2449 W 13th St
- 2243 W 4th St
- 1854 W 8th St
- 321 Cedar St
- 1824 W 8th St
- 211 Cedar St
- 120 N Pine St
- 2011 W 2nd St
- 2312 1/2 W 1st St
- 2312 W 1st St
- 1815 W 3rd St
- 1701 W 8th St