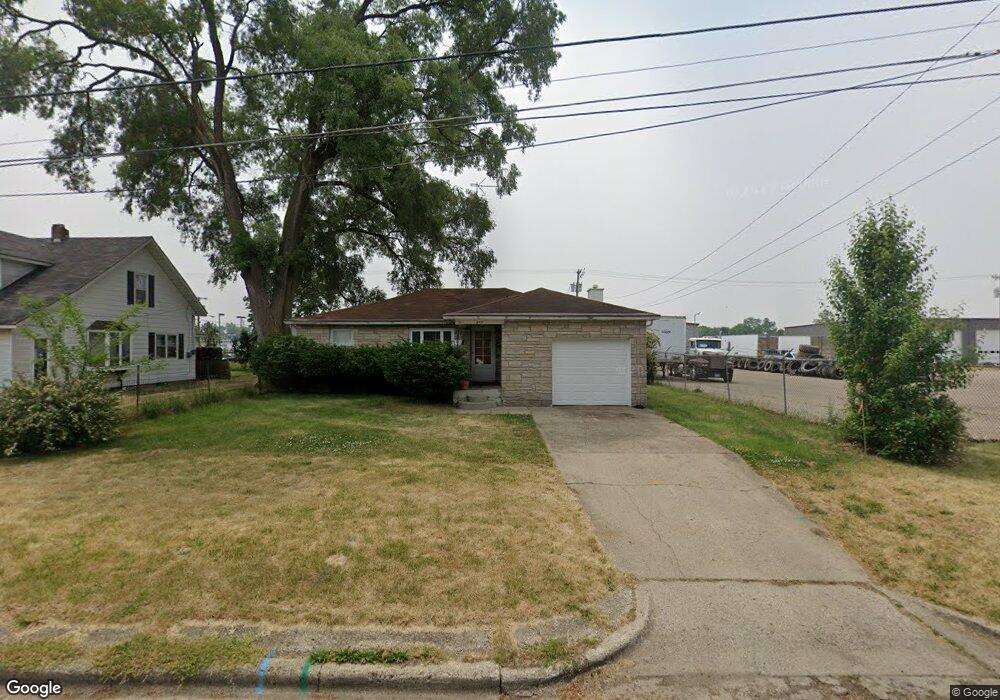
906 Neuman St Sturgis, MI 49091
Estimated Value: $100,000 - $147,379
--
Bed
--
Bath
868
Sq Ft
$148/Sq Ft
Est. Value
About This Home
This home is located at 906 Neuman St, Sturgis, MI 49091 and is currently estimated at $128,845, approximately $148 per square foot. 906 Neuman St is a home located in St. Joseph County with nearby schools including Sturgis High School and Trinity Lutheran School.
Ownership History
Date
Name
Owned For
Owner Type
Purchase Details
Closed on
Oct 10, 2013
Sold by
Fair Norma M
Bought by
Fair Norma M and Fair John M
Current Estimated Value
Purchase Details
Closed on
Apr 8, 2013
Sold by
Fair John M and Fair Chelina Cae
Bought by
Fair Norma M
Purchase Details
Closed on
Dec 7, 2011
Sold by
Fair Diana L
Bought by
Fair John M
Purchase Details
Closed on
Nov 13, 2009
Sold by
Perry Gayla
Bought by
Fair John M and Fair Diana L
Home Financials for this Owner
Home Financials are based on the most recent Mortgage that was taken out on this home.
Original Mortgage
$36,000
Outstanding Balance
$23,386
Interest Rate
4.9%
Mortgage Type
Commercial
Estimated Equity
$105,459
Purchase Details
Closed on
Oct 26, 2007
Sold by
Smith Eva M and Smith Labon O
Bought by
Perry Gayla
Purchase Details
Closed on
Mar 11, 1996
Create a Home Valuation Report for This Property
The Home Valuation Report is an in-depth analysis detailing your home's value as well as a comparison with similar homes in the area
Home Values in the Area
Average Home Value in this Area
Purchase History
| Date | Buyer | Sale Price | Title Company |
|---|---|---|---|
| Fair Norma M | -- | None Available | |
| Fair Norma M | -- | None Available | |
| Fair John M | -- | None Available | |
| Fair John M | $35,000 | None Available | |
| Perry Gayla | $56,000 | Vt | |
| -- | -- | -- |
Source: Public Records
Mortgage History
| Date | Status | Borrower | Loan Amount |
|---|---|---|---|
| Open | Fair John M | $36,000 |
Source: Public Records
Tax History Compared to Growth
Tax History
| Year | Tax Paid | Tax Assessment Tax Assessment Total Assessment is a certain percentage of the fair market value that is determined by local assessors to be the total taxable value of land and additions on the property. | Land | Improvement |
|---|---|---|---|---|
| 2025 | $1,947 | $59,000 | $4,800 | $54,200 |
| 2024 | $1,709 | $53,600 | $4,200 | $49,400 |
| 2023 | $1,649 | $46,300 | $4,200 | $42,100 |
| 2022 | $1,536 | $40,400 | $3,800 | $36,600 |
| 2021 | $1,727 | $35,500 | $3,700 | $31,800 |
| 2020 | $1,707 | $31,400 | $2,800 | $28,600 |
| 2019 | $1,675 | $27,700 | $3,300 | $24,400 |
| 2018 | $1,550 | $29,800 | $2,600 | $27,200 |
| 2017 | $1,517 | $26,300 | $26,300 | $0 |
| 2016 | -- | $25,500 | $25,500 | $0 |
| 2015 | -- | $25,700 | $0 | $0 |
| 2014 | -- | $24,900 | $24,900 | $0 |
| 2012 | -- | $23,900 | $23,900 | $0 |
Source: Public Records
Map
Nearby Homes
- 212 N Orange St
- 26865 Us Highway 12
- 203 Grove St
- 600 Saint Joseph St
- 210 Grove St
- 200 Broadus St
- 411 Wenzel Ave
- 202 N Clay St
- 702 S Orange St
- 69375 Vicky Dr
- 607 N Nottawa St
- 701 N Nottawa St
- 416 Sturgis St
- 402 N 4th St
- 105 Jean St
- 302 E Electric Ct
- 605 E West St
- 405 Michigan Ave
- 503 Michigan Ave
- 505 Michigan Ave