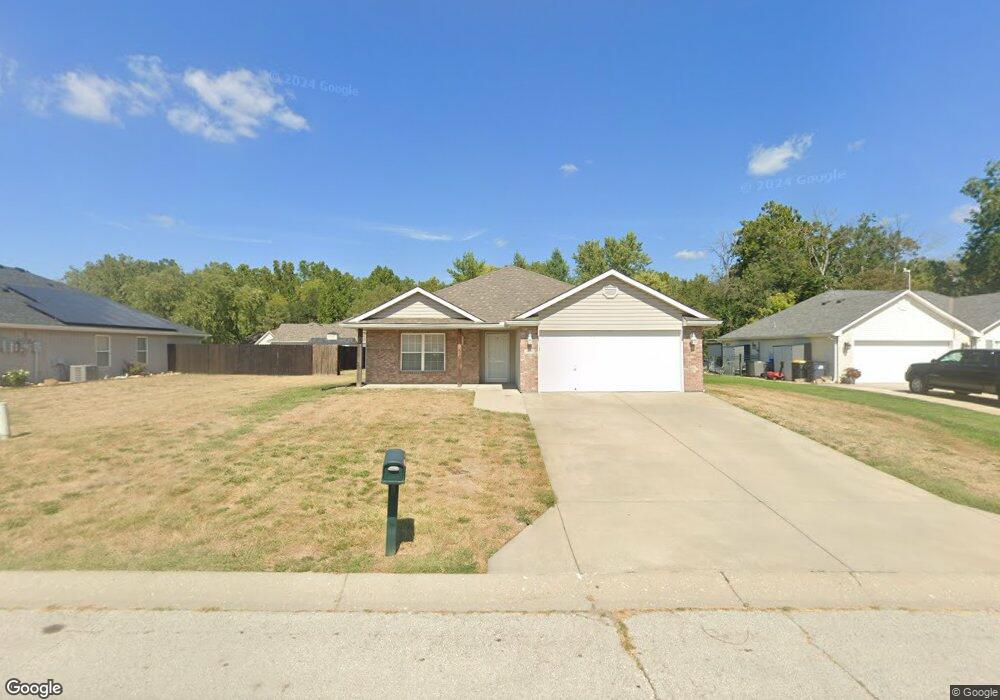
906 Sandy Ct Grain Valley, MO 64029
Estimated Value: $293,000 - $296,000
3
Beds
2
Baths
1,490
Sq Ft
$198/Sq Ft
Est. Value
About This Home
This home is located at 906 Sandy Ct, Grain Valley, MO 64029 and is currently estimated at $294,395, approximately $197 per square foot. 906 Sandy Ct is a home located in Jackson County with nearby schools including Grain Valley High School.
Ownership History
Date
Name
Owned For
Owner Type
Purchase Details
Closed on
Oct 29, 2021
Sold by
Premium Custom Hoems Llc
Bought by
Barzee Jared and Barzee Ashley
Current Estimated Value
Home Financials for this Owner
Home Financials are based on the most recent Mortgage that was taken out on this home.
Original Mortgage
$285,951
Outstanding Balance
$260,761
Interest Rate
2.8%
Mortgage Type
FHA
Estimated Equity
$33,634
Purchase Details
Closed on
Mar 14, 2003
Sold by
Eilers Investments Inc
Bought by
Dynamic Investments Inc
Home Financials for this Owner
Home Financials are based on the most recent Mortgage that was taken out on this home.
Original Mortgage
$98,400
Interest Rate
5.77%
Mortgage Type
Construction
Create a Home Valuation Report for This Property
The Home Valuation Report is an in-depth analysis detailing your home's value as well as a comparison with similar homes in the area
Home Values in the Area
Average Home Value in this Area
Purchase History
| Date | Buyer | Sale Price | Title Company |
|---|---|---|---|
| Barzee Jared | -- | None Available | |
| Dynamic Investments Inc | -- | -- |
Source: Public Records
Mortgage History
| Date | Status | Borrower | Loan Amount |
|---|---|---|---|
| Open | Barzee Jared | $285,951 | |
| Previous Owner | Dynamic Investments Inc | $98,400 |
Source: Public Records
Tax History Compared to Growth
Tax History
| Year | Tax Paid | Tax Assessment Tax Assessment Total Assessment is a certain percentage of the fair market value that is determined by local assessors to be the total taxable value of land and additions on the property. | Land | Improvement |
|---|---|---|---|---|
| 2025 | $3,106 | $37,189 | $7,070 | $30,119 |
| 2024 | $2,990 | $37,706 | $4,913 | $32,793 |
| 2023 | $2,990 | $37,706 | $5,136 | $32,570 |
| 2022 | $2,549 | $28,120 | $4,425 | $23,695 |
| 2021 | $2,489 | $28,120 | $4,425 | $23,695 |
| 2020 | $2,525 | $28,136 | $4,425 | $23,711 |
| 2019 | $2,474 | $28,136 | $4,425 | $23,711 |
| 2018 | $2,304 | $24,487 | $3,851 | $20,636 |
| 2017 | $2,304 | $24,487 | $3,851 | $20,636 |
| 2016 | $2,012 | $21,396 | $4,600 | $16,796 |
| 2014 | $1,988 | $20,976 | $4,510 | $16,466 |
Source: Public Records
Map
Nearby Homes
- 209 SW Cross Creek Dr
- 725 SW Tisha Ln
- 207 Pebblebrook St
- 1024 Christie Ln
- 200 Cross Creek Ln
- 640 SW Crestview Dr
- 506 SW Meadowood Dr
- 636 SW Lakeview Dr
- 621 SW Tisha Ln
- 518 South St
- 509 SW Joseph Ct
- 1215 SW Lone Star Ct
- 512 Broadway St
- 601 SW Nelson Dr
- 1214 SW Windcrest Ct
- 1418 SW Blue Branch Dr
- 1219 SW Windcrest Ct
- 913 SW Abar Dr
- 808 SW Country Hill Dr
- 1001 SW Cross Creek Dr