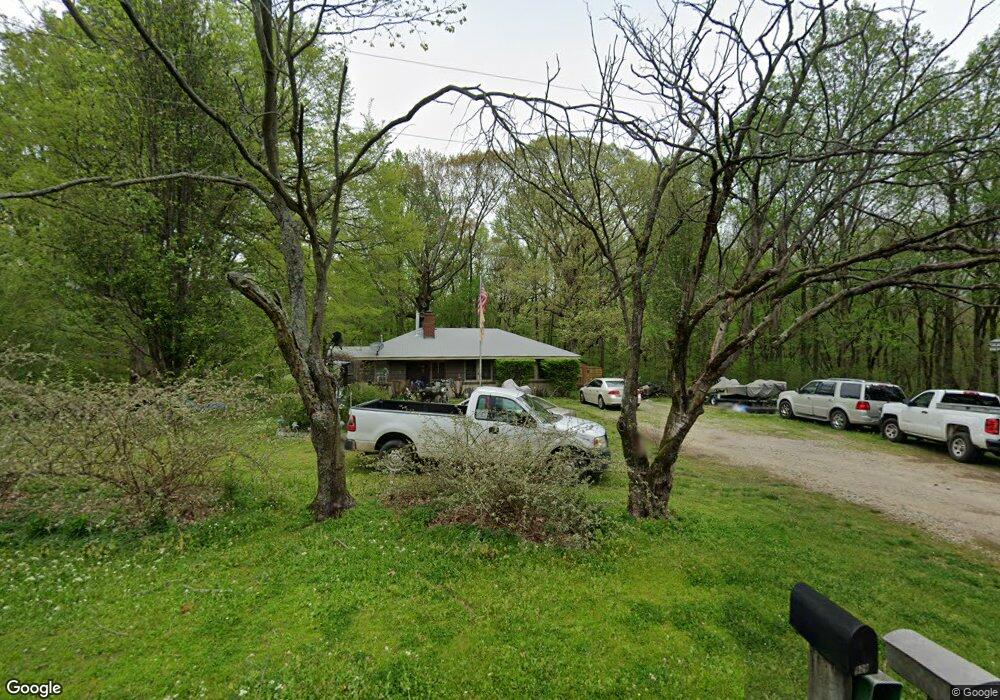
906 Sylvan Rd Millington, TN 38053
Estimated Value: $177,193 - $206,000
2
Beds
1
Bath
1,002
Sq Ft
$187/Sq Ft
Est. Value
About This Home
This home is located at 906 Sylvan Rd, Millington, TN 38053 and is currently estimated at $187,298, approximately $186 per square foot. 906 Sylvan Rd is a home located in Shelby County with nearby schools including E.E. Jeter Elementary School and Trezevant High School.
Ownership History
Date
Name
Owned For
Owner Type
Purchase Details
Closed on
Sep 24, 2018
Sold by
Escue James
Bought by
Smith Katherine L and Smith Timothy A
Current Estimated Value
Home Financials for this Owner
Home Financials are based on the most recent Mortgage that was taken out on this home.
Original Mortgage
$35,200
Outstanding Balance
$30,633
Interest Rate
4.5%
Mortgage Type
Commercial
Estimated Equity
$156,665
Purchase Details
Closed on
Apr 25, 2016
Sold by
Perkins Rose
Bought by
Perkins Joseph
Purchase Details
Closed on
Oct 10, 2012
Sold by
Hancock Jerrod
Bought by
Eseue James
Purchase Details
Closed on
Jan 22, 2008
Sold by
Perkins Joseph and Perkins Rose
Bought by
Hancock Jerrod R
Home Financials for this Owner
Home Financials are based on the most recent Mortgage that was taken out on this home.
Original Mortgage
$89,450
Interest Rate
6.17%
Mortgage Type
Purchase Money Mortgage
Purchase Details
Closed on
Dec 6, 2002
Sold by
Roberts Teresa
Bought by
Perkins Joseph and Perkins Rose
Purchase Details
Closed on
Aug 29, 2002
Sold by
Wilson Jacqueline
Bought by
Perkins Joseph and Perkins Rose
Purchase Details
Closed on
Aug 28, 2002
Sold by
Roberts Ralph
Bought by
Perkins Joseph and Perkins Rose
Create a Home Valuation Report for This Property
The Home Valuation Report is an in-depth analysis detailing your home's value as well as a comparison with similar homes in the area
Home Values in the Area
Average Home Value in this Area
Purchase History
| Date | Buyer | Sale Price | Title Company |
|---|---|---|---|
| Smith Katherine L | $45,000 | None Available | |
| Perkins Joseph | -- | None Available | |
| Eseue James | $89,000 | None Available | |
| Hancock Jerrod R | $89,450 | Realty Title | |
| Perkins Joseph | $12,500 | -- | |
| Perkins Joseph | -- | -- | |
| Perkins Joseph | -- | -- | |
| Perkins Joseph | -- | -- |
Source: Public Records
Mortgage History
| Date | Status | Borrower | Loan Amount |
|---|---|---|---|
| Open | Smith Katherine L | $35,200 | |
| Previous Owner | Hancock Jerrod R | $89,450 |
Source: Public Records
Tax History Compared to Growth
Tax History
| Year | Tax Paid | Tax Assessment Tax Assessment Total Assessment is a certain percentage of the fair market value that is determined by local assessors to be the total taxable value of land and additions on the property. | Land | Improvement |
|---|---|---|---|---|
| 2025 | $991 | $36,475 | $11,700 | $24,775 |
| 2024 | $991 | $29,225 | $11,125 | $18,100 |
| 2023 | $991 | $29,225 | $11,125 | $18,100 |
| 2022 | $991 | $29,225 | $11,125 | $18,100 |
| 2021 | $1,008 | $29,225 | $11,125 | $18,100 |
| 2020 | $852 | $21,025 | $11,125 | $9,900 |
| 2019 | $852 | $21,025 | $11,125 | $9,900 |
| 2018 | $852 | $21,025 | $11,125 | $9,900 |
| 2017 | $864 | $21,025 | $11,125 | $9,900 |
| 2016 | $902 | $20,650 | $0 | $0 |
| 2014 | $902 | $20,650 | $0 | $0 |
Source: Public Records
Map
Nearby Homes
- 6621 Benjestown Rd
- 6443 N Watkins St
- 6224 Benjestown Rd
- 6525 N Watkins Rd
- 0 N Watkins Unit 10203950
- 0 N Watkins Unit 10193620
- 6007 Island Forty Rd
- 1435 Walsh Cove
- 5921 Benjestown Rd
- 1 Walsh Rd
- 6770 Camp John Rd
- 5423 Breckenwood Dr
- 7441 Walsh Rd
- 1907 Campbell Rd
- 1 Robertson Rd
- 5387 Cornstalk Cove
- 5382 Beaverton Dr
- 5371 Cedar Bluff Dr
- 6642 Benjestown Rd
- 5315 Braden Dr
- 891 Sylvan Rd
- 895 Sylvan Rd
- 887 Sylvan Rd
- 929 Sylvan Rd
- 842 Sylvan Rd
- 865 Sylvan Rd
- 0 Sylvan Rd Unit 3154008
- 0 Sylvan Rd Unit 10119546
- 936 Sylvan Rd
- 845 Sylvan Rd
- 945 Sylvan Rd
- 981 Sylvan Rd
- 841 Sylvan Rd
- 832 Sylvan Rd
- 1000 Sylvan Rd
- 1030 Sylvan Rd
- 820 Sylvan Rd
- 785 Sylvan Rd
- 765 Sylvan Rd
- 1021 Sylvan Rd