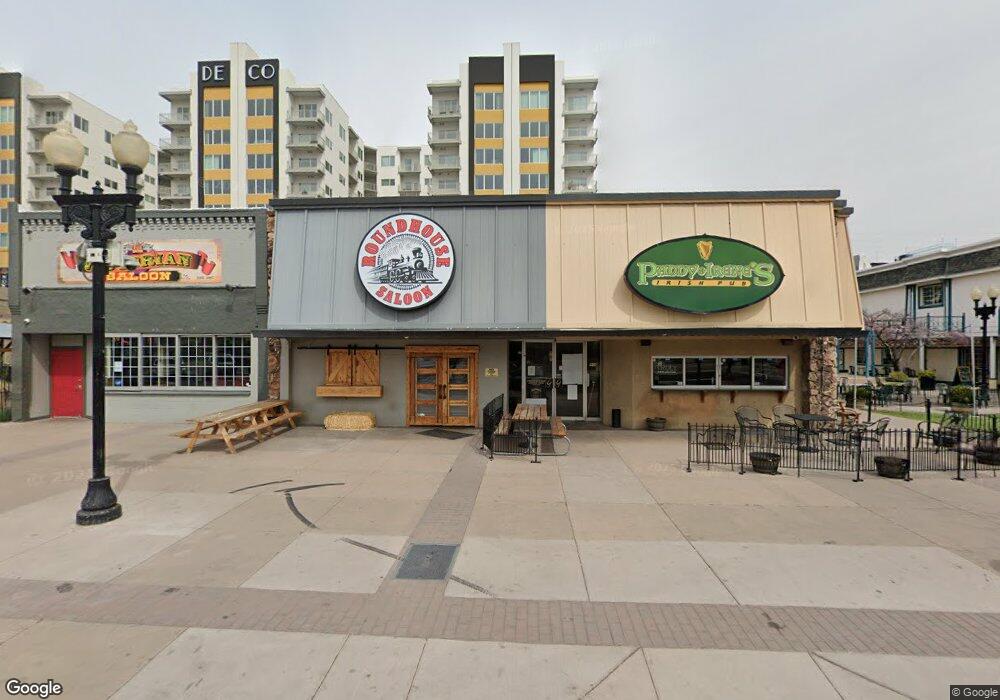
906 Victorian Ave Sparks, NV 89431
Downtown Sparks NeighborhoodEstimated Value: $1,498,892
--
Bed
--
Bath
9,558
Sq Ft
$157/Sq Ft
Est. Value
About This Home
This home is located at 906 Victorian Ave, Sparks, NV 89431 and is currently estimated at $1,498,892, approximately $156 per square foot. 906 Victorian Ave is a home located in Washoe County with nearby schools including Robert Mitchell Elementary School, Sparks Middle School, and Sparks High School.
Ownership History
Date
Name
Owned For
Owner Type
Purchase Details
Closed on
Oct 3, 2017
Sold by
Gazins Inc
Bought by
Redev Group Llc
Current Estimated Value
Purchase Details
Closed on
Nov 15, 2005
Sold by
Belizian One Development S A
Bought by
Gazins Inc
Purchase Details
Closed on
Sep 4, 2001
Sold by
Judd Glen H
Bought by
Belizian One Development Sa
Home Financials for this Owner
Home Financials are based on the most recent Mortgage that was taken out on this home.
Original Mortgage
$300,000
Interest Rate
7.18%
Mortgage Type
Seller Take Back
Create a Home Valuation Report for This Property
The Home Valuation Report is an in-depth analysis detailing your home's value as well as a comparison with similar homes in the area
Home Values in the Area
Average Home Value in this Area
Purchase History
| Date | Buyer | Sale Price | Title Company |
|---|---|---|---|
| Redev Group Llc | $900,000 | Ticor Title Reno | |
| Gazins Inc | $500,000 | None Available | |
| Belizian One Development Sa | $500,000 | Stewart Title Northern Nevad |
Source: Public Records
Mortgage History
| Date | Status | Borrower | Loan Amount |
|---|---|---|---|
| Previous Owner | Belizian One Development Sa | $300,000 |
Source: Public Records
Tax History Compared to Growth
Tax History
| Year | Tax Paid | Tax Assessment Tax Assessment Total Assessment is a certain percentage of the fair market value that is determined by local assessors to be the total taxable value of land and additions on the property. | Land | Improvement |
|---|---|---|---|---|
| 2025 | $5,696 | $172,649 | $29,274 | $143,375 |
| 2024 | $5,696 | $172,667 | $29,274 | $143,393 |
| 2023 | $5,276 | $158,422 | $32,201 | $126,221 |
| 2022 | $4,886 | $133,042 | $29,518 | $103,524 |
| 2021 | $5,082 | $138,612 | $36,897 | $101,715 |
| 2020 | $5,098 | $138,647 | $36,897 | $101,750 |
| 2019 | $4,856 | $131,783 | $36,227 | $95,556 |
| 2018 | $4,715 | $127,864 | $34,214 | $93,650 |
| 2017 | $4,685 | $126,991 | $34,214 | $92,777 |
| 2016 | $4,558 | $125,178 | $34,214 | $90,964 |
| 2015 | $4,556 | $124,091 | $34,214 | $89,877 |
| 2014 | $4,466 | $121,515 | $34,214 | $87,301 |
| 2013 | -- | $130,768 | $45,619 | $85,149 |
Source: Public Records
Map
Nearby Homes