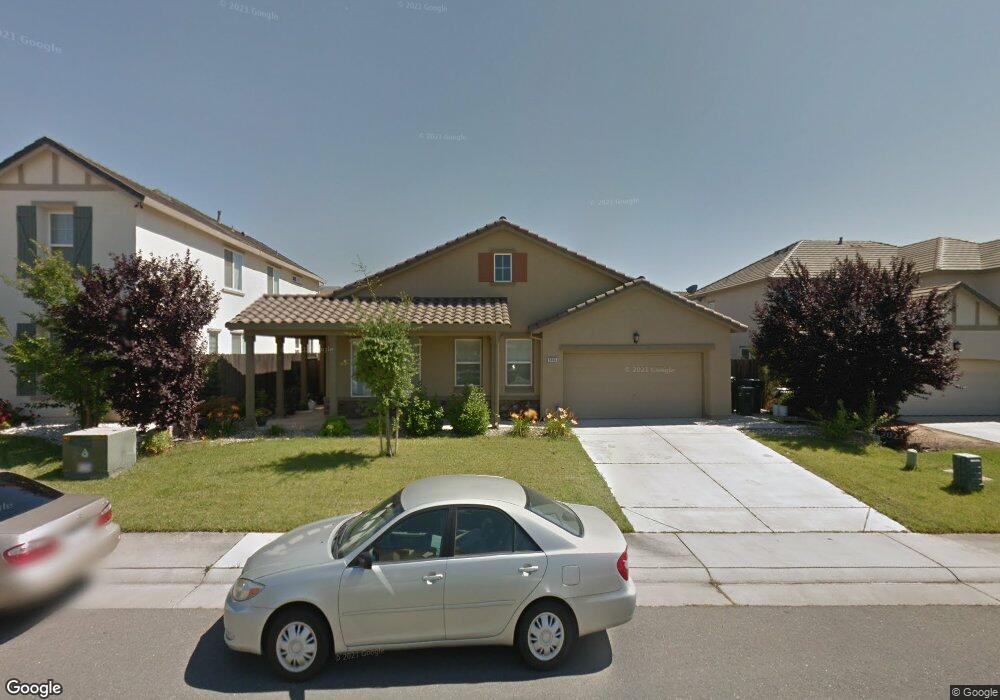
9060 Cobble Point Way Sacramento, CA 95829
Estimated Value: $624,303 - $673,000
4
Beds
3
Baths
2,439
Sq Ft
$266/Sq Ft
Est. Value
About This Home
This home is located at 9060 Cobble Point Way, Sacramento, CA 95829 and is currently estimated at $649,826, approximately $266 per square foot. 9060 Cobble Point Way is a home located in Sacramento County with nearby schools including Maeola E. Beitzel Elementary School, T. R. Smedberg Middle School, and Sheldon High School.
Ownership History
Date
Name
Owned For
Owner Type
Purchase Details
Closed on
Jan 2, 2015
Sold by
Nguyen Trang
Bought by
Le David
Current Estimated Value
Home Financials for this Owner
Home Financials are based on the most recent Mortgage that was taken out on this home.
Original Mortgage
$280,000
Outstanding Balance
$214,309
Interest Rate
3.82%
Mortgage Type
New Conventional
Estimated Equity
$435,517
Purchase Details
Closed on
Mar 20, 2013
Sold by
Le Ly
Bought by
Le Ly and Le David
Purchase Details
Closed on
Mar 21, 2008
Sold by
Chung Linh
Bought by
Le Ly
Home Financials for this Owner
Home Financials are based on the most recent Mortgage that was taken out on this home.
Original Mortgage
$301,500
Interest Rate
4.75%
Mortgage Type
Purchase Money Mortgage
Purchase Details
Closed on
Dec 31, 2007
Sold by
Morrison Homes Inc
Bought by
Taylor Morrison Of California Llc
Create a Home Valuation Report for This Property
The Home Valuation Report is an in-depth analysis detailing your home's value as well as a comparison with similar homes in the area
Home Values in the Area
Average Home Value in this Area
Purchase History
| Date | Buyer | Sale Price | Title Company |
|---|---|---|---|
| Le David | -- | Orange Coast Title Company | |
| Le David | -- | Orange Coast Title Company | |
| Le Ly | -- | Orange Coast Title Company | |
| Le Ly | -- | None Available | |
| Le Ly | -- | First American Title Company | |
| Le Ly | $335,000 | First American Title Company | |
| Taylor Morrison Of California Llc | -- | None Available |
Source: Public Records
Mortgage History
| Date | Status | Borrower | Loan Amount |
|---|---|---|---|
| Open | Le Ly | $280,000 | |
| Closed | Le Ly | $280,000 | |
| Closed | Le Ly | $301,500 |
Source: Public Records
Tax History Compared to Growth
Tax History
| Year | Tax Paid | Tax Assessment Tax Assessment Total Assessment is a certain percentage of the fair market value that is determined by local assessors to be the total taxable value of land and additions on the property. | Land | Improvement |
|---|---|---|---|---|
| 2025 | $7,148 | $412,293 | $146,579 | $265,714 |
| 2024 | $7,148 | $404,209 | $143,705 | $260,504 |
| 2023 | $6,415 | $396,285 | $140,888 | $255,397 |
| 2022 | $6,173 | $388,516 | $138,126 | $250,390 |
| 2021 | $4,305 | $380,899 | $135,418 | $245,481 |
| 2020 | $4,248 | $376,994 | $134,030 | $242,964 |
| 2019 | $4,172 | $369,602 | $131,402 | $238,200 |
| 2018 | $4,062 | $362,356 | $128,826 | $233,530 |
| 2017 | $3,993 | $355,251 | $126,300 | $228,951 |
| 2016 | $3,794 | $348,286 | $123,824 | $224,462 |
| 2015 | $3,956 | $366,121 | $163,935 | $202,186 |
| 2014 | $3,892 | $358,950 | $160,724 | $198,226 |
Source: Public Records
Map
Nearby Homes
- 9028 Brittany Park Dr
- 9065 Robbins Rd
- 8990 Chantal Way
- 9040 Durness Way
- 9169 Garlington Ct
- 8269 Red Rock Dr
- 8352 Tannic Dr
- 8906 Cobble Crest Dr
- 8902 Cobble Crest Dr
- 9209 Rosecut Ct
- 8048 Caymus Dr
- 9172 Durness Way
- 8353 Foppiano Way
- 8054 Boeger Ct
- 8373 Foppiano Way
- 9042 Epernay Ct
- 8027 Wente Way
- 8916 Hollowstone Way
- 9100 Lakemont Dr
- 8836 Inisheer Way
- 9056 Cobble Point Way
- 9064 Cobble Point Way
- 9061 Marble Valley Ct
- 9052 Cobble Point Way
- 9057 Marble Valley Ct
- 9068 Cobble Point Way
- 9065 Marble Valley Ct
- 9061 Cobble Point Way
- 9057 Cobble Point Way
- 9065 Cobble Point Way
- 9069 Marble Valley Ct
- 9053 Marble Valley Ct
- 9053 Cobble Point Way
- 9069 Cobble Point Way
- 9061 Pebble Field Way
- 9065 Pebble Field Way
- 9045 Martine Ct
- 9053 Pebble Field Way
- 9076 Marble Crest Ct
- 9060 Marble Valley Ct