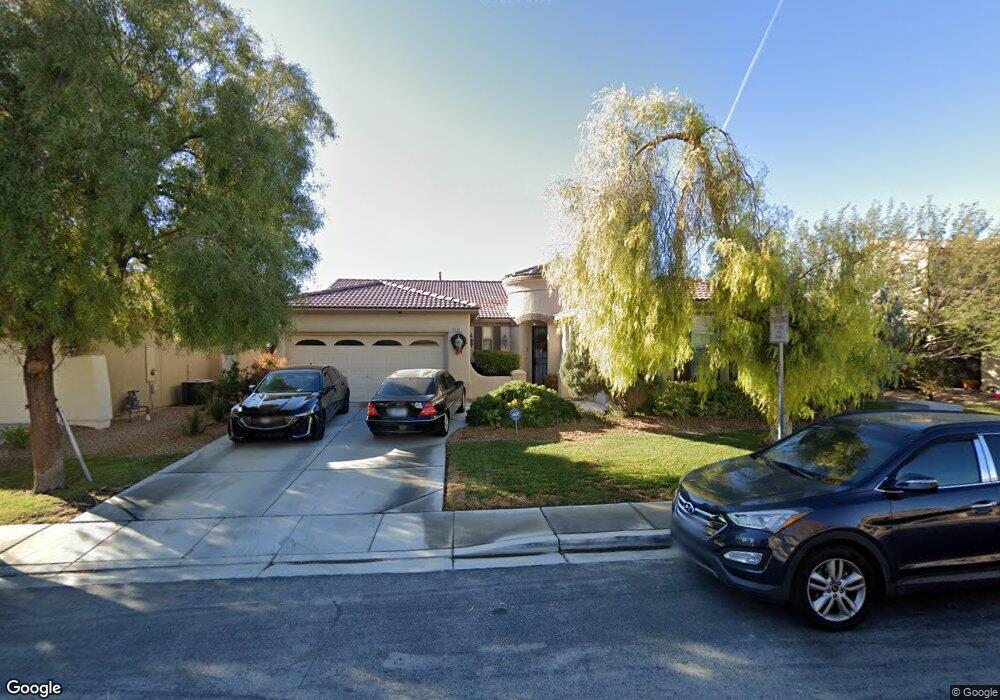
9061 Glasbury Ct Las Vegas, NV 89123
Silverado Ranch NeighborhoodEstimated Value: $566,257 - $617,000
3
Beds
3
Baths
2,396
Sq Ft
$249/Sq Ft
Est. Value
About This Home
This home is located at 9061 Glasbury Ct, Las Vegas, NV 89123 and is currently estimated at $597,314, approximately $249 per square foot. 9061 Glasbury Ct is a home located in Clark County with nearby schools including John R Beatty Elementary School, Jack Lund Schofield Middle School, and Liberty High School.
Ownership History
Date
Name
Owned For
Owner Type
Purchase Details
Closed on
Mar 12, 2020
Sold by
Wilson Samuel
Bought by
Wilson Samuel
Current Estimated Value
Home Financials for this Owner
Home Financials are based on the most recent Mortgage that was taken out on this home.
Original Mortgage
$75,000
Outstanding Balance
$66,423
Interest Rate
3.5%
Mortgage Type
Credit Line Revolving
Estimated Equity
$530,891
Purchase Details
Closed on
Sep 25, 2006
Sold by
Santora Richard
Bought by
Wilson Samuel and Wilson Joyce Y
Home Financials for this Owner
Home Financials are based on the most recent Mortgage that was taken out on this home.
Original Mortgage
$372,000
Outstanding Balance
$150,573
Interest Rate
1%
Mortgage Type
Negative Amortization
Estimated Equity
$446,741
Purchase Details
Closed on
Feb 20, 2003
Sold by
Pardee Homes Of Nevada
Bought by
Santora Richard
Home Financials for this Owner
Home Financials are based on the most recent Mortgage that was taken out on this home.
Original Mortgage
$224,251
Interest Rate
5.83%
Create a Home Valuation Report for This Property
The Home Valuation Report is an in-depth analysis detailing your home's value as well as a comparison with similar homes in the area
Home Values in the Area
Average Home Value in this Area
Purchase History
| Date | Buyer | Sale Price | Title Company |
|---|---|---|---|
| Wilson Samuel | -- | Lawyers Title Henderson | |
| Wilson Samuel | $465,000 | Equity Title Of Nevada | |
| Santora Richard | $237,434 | First American Title Company |
Source: Public Records
Mortgage History
| Date | Status | Borrower | Loan Amount |
|---|---|---|---|
| Open | Wilson Samuel | $75,000 | |
| Open | Wilson Samuel | $372,000 | |
| Previous Owner | Santora Richard | $224,251 |
Source: Public Records
Tax History Compared to Growth
Tax History
| Year | Tax Paid | Tax Assessment Tax Assessment Total Assessment is a certain percentage of the fair market value that is determined by local assessors to be the total taxable value of land and additions on the property. | Land | Improvement |
|---|---|---|---|---|
| 2025 | $2,697 | $151,548 | $46,550 | $104,998 |
| 2024 | $2,619 | $151,548 | $46,550 | $104,998 |
| 2023 | $2,077 | $142,250 | $42,700 | $99,550 |
| 2022 | $2,543 | $128,838 | $38,150 | $90,688 |
| 2021 | $2,606 | $117,790 | $31,500 | $86,290 |
| 2020 | $2,394 | $117,283 | $31,850 | $85,433 |
| 2019 | $2,325 | $113,693 | $29,750 | $83,943 |
| 2018 | $2,218 | $104,204 | $23,450 | $80,754 |
| 2017 | $3,027 | $103,226 | $22,400 | $80,826 |
| 2016 | $2,077 | $97,481 | $19,250 | $78,231 |
| 2015 | $2,072 | $75,879 | $14,700 | $61,179 |
| 2014 | $2,012 | $66,547 | $8,750 | $57,797 |
Source: Public Records
Map
Nearby Homes
- 9072 Ravenhurst St
- 9113 Black Slate St
- 315 Barletta Ave
- 280 Cascade Mist Ave
- 379 Golden Shore Dr
- 9131 Penn Station St
- 87 E Agate Ave Unit 202
- 8725 Placid St
- 75 E Agate Ave Unit 206
- 9000 Las Vegas Blvd S Unit 1250
- 9000 Las Vegas Blvd S Unit 1005
- 9000 Las Vegas Blvd S Unit 1097
- 9000 Las Vegas Blvd S Unit 2117
- 9000 Las Vegas Blvd S Unit 2168
- 9000 Las Vegas Blvd S Unit 1142
- 9000 Las Vegas Blvd S Unit 1300
- 9000 Las Vegas Blvd S Unit 1004
- 9000 Las Vegas Blvd S Unit 1037
- 9000 Las Vegas Blvd S Unit 2238
- 9000 Las Vegas Blvd S Unit 2171
- 9069 Glasbury Ct
- 9053 Glasbury Ct
- 9060 Rainsbrook St
- 9068 Rainsbrook St
- 9077 Glasbury Ct
- 9052 Rainsbrook St
- 9062 Glasbury Ct
- 9076 Rainsbrook St
- 9044 Rainsbrook St
- 9070 Glasbury Ct
- 9054 Glasbury Ct
- 251 Pebble Canyon Dr
- 257 Pebble Canyon Dr
- 9078 Glasbury Ct
- 263 Pebble Canyon Dr
- 263 Pebble Canyon Dr Unit n/a
- 9084 Rainsbrook St
- 9036 Rainsbrook St
- 9086 Glasbury Ct
- 269 Pebble Canyon Dr