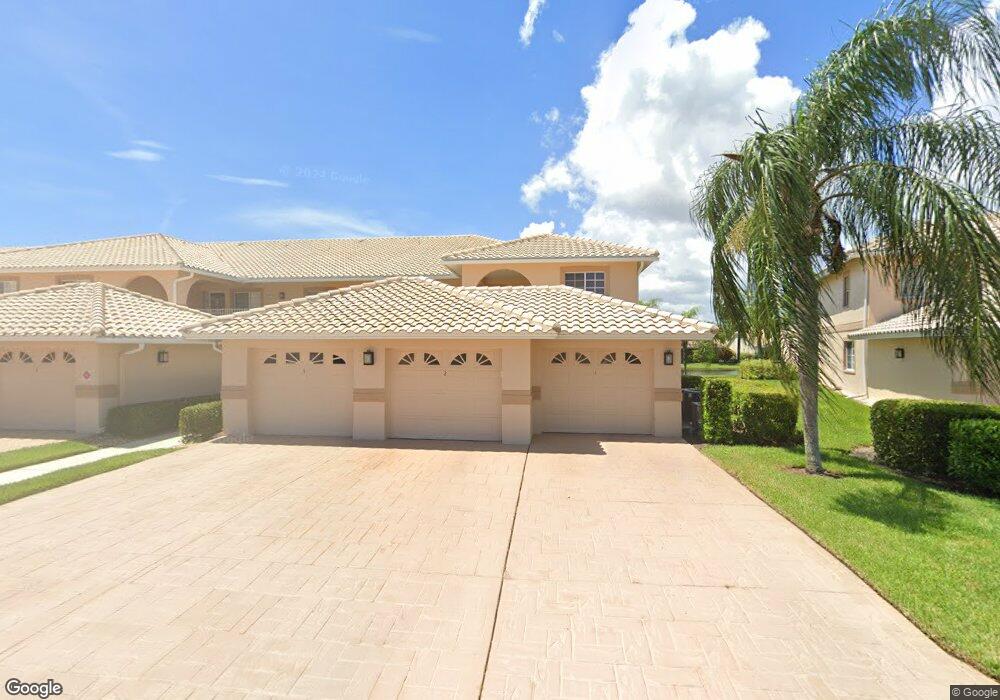
9061 Michael Cir Unit 508 Naples, FL 34113
Lely Resort NeighborhoodEstimated Value: $345,000 - $397,000
Studio
--
Bath
1,450
Sq Ft
$254/Sq Ft
Est. Value
About This Home
This home is located at 9061 Michael Cir Unit 508, Naples, FL 34113 and is currently estimated at $368,150, approximately $253 per square foot. 9061 Michael Cir Unit 508 is a home located in Collier County with nearby schools including Lely Elementary School, Manatee Middle School, and Lely High School.
Ownership History
Date
Name
Owned For
Owner Type
Purchase Details
Closed on
Jul 30, 2012
Sold by
Baker Norman and Baker Florence
Bought by
Gannon Donna L
Current Estimated Value
Purchase Details
Closed on
Aug 9, 2007
Sold by
Baker Norman M and Baker Florence M
Bought by
Baker Norman and Baker Florence
Purchase Details
Closed on
Mar 10, 2000
Sold by
Dougherty Michael R and Dougherty Eileen J
Bought by
Baker Norman M and Baker Florence M
Home Financials for this Owner
Home Financials are based on the most recent Mortgage that was taken out on this home.
Original Mortgage
$70,000
Interest Rate
8.29%
Mortgage Type
Purchase Money Mortgage
Purchase Details
Closed on
Oct 10, 1996
Sold by
Royalty Dev Corp
Bought by
Dougherty Michael R and Dougherty Eileen J
Home Financials for this Owner
Home Financials are based on the most recent Mortgage that was taken out on this home.
Original Mortgage
$83,000
Interest Rate
7.87%
Mortgage Type
Purchase Money Mortgage
Create a Home Valuation Report for This Property
The Home Valuation Report is an in-depth analysis detailing your home's value as well as a comparison with similar homes in the area
Home Values in the Area
Average Home Value in this Area
Purchase History
| Date | Buyer | Sale Price | Title Company |
|---|---|---|---|
| Gannon Donna L | $195,000 | Attorney | |
| Baker Norman | -- | None Available | |
| Baker Norman M | $140,000 | -- | |
| Dougherty Michael R | $116,300 | -- |
Source: Public Records
Mortgage History
| Date | Status | Borrower | Loan Amount |
|---|---|---|---|
| Previous Owner | Baker Norman M | $70,000 | |
| Previous Owner | Dougherty Michael R | $83,000 |
Source: Public Records
Tax History
| Year | Tax Paid | Tax Assessment Tax Assessment Total Assessment is a certain percentage of the fair market value that is determined by local assessors to be the total taxable value of land and additions on the property. | Land | Improvement |
|---|---|---|---|---|
| 2025 | $3,154 | $272,853 | -- | -- |
| 2024 | $3,126 | $265,163 | -- | -- |
| 2023 | $3,126 | $257,440 | $0 | $0 |
| 2022 | $3,183 | $249,942 | $0 | $249,942 |
| 2021 | $3,170 | $206,150 | $0 | $206,150 |
| 2020 | $3,015 | $196,150 | $0 | $196,150 |
| 2019 | $2,965 | $190,350 | $0 | $190,350 |
| 2018 | $2,912 | $186,000 | $0 | $186,000 |
| 2017 | $2,869 | $186,000 | $0 | $186,000 |
| 2016 | $2,721 | $176,261 | $0 | $0 |
| 2015 | $2,575 | $160,237 | $0 | $0 |
| 2014 | $2,367 | $145,670 | $0 | $0 |
Source: Public Records
Map
Nearby Homes
- 9061 Michael Cir Unit 2
- 9035 Michael Cir Unit 5
- 9035 Michael Cir Unit 3
- 9087 Michael Cir Unit 9
- 9022 Michael Cir Unit 3
- 9113 Michael Cir Unit 10
- 9113 Michael Cir Unit 6
- 9009 Michael Cir Unit 4
- 9195 Michael Cir Unit 1303
- 8586 Mustang Dr Unit 25
- 9165 Michael Cir Unit 1002
- 8968 Morgan Ct
- 8515 Mystic Greens Way Unit 106
- 8500 Mystic Greens Way Unit 506
- 8440 Mystic Greens Way Unit 1001
- 8983 Mustang Island Cir
- 9049 Bronco Ct
- 8840 Mariposa Ct
- 8856 Lely Island Cir
- 9061 Michael Cir Unit 12
- 9061 Michael Cir Unit 5-504
- 9061 Michael Cir Unit 9
- 9061 Michael Cir Unit 1
- 9061 Michael Cir Unit 4
- 9061 Michael Cir
- 9061 Michael Cir Unit 10
- 9061 Michael Cir Unit 5-512
- 9061 Michael Cir Unit 5
- 9061 Michael Cir Unit 5-7
- 9061 Michael Cir Unit 5-506
- 9061 Michael Cir Unit 5-507
- 9061 Michael Cir Unit 5-511
- 9061 Michael Cir Unit 7
- 9061 Michael Cir Unit 512
- 9061 Michael Cir Unit 511
- 9061 Michael Cir Unit 510
- 9061 Michael Cir Unit 507
- 9061 Michael Cir Unit 506
- 9061 Michael Cir Unit 505
Your Personal Tour Guide
Ask me questions while you tour the home.