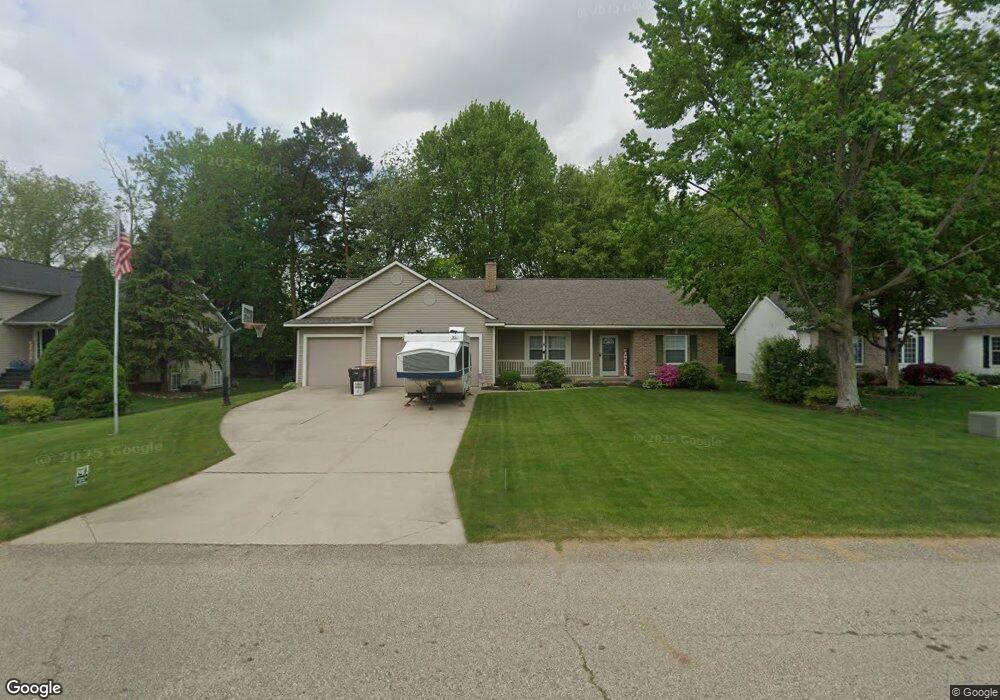
9067 Cedarview Ave Jenison, MI 49428
Estimated Value: $401,735 - $443,000
4
Beds
3
Baths
2,350
Sq Ft
$176/Sq Ft
Est. Value
About This Home
This home is located at 9067 Cedarview Ave, Jenison, MI 49428 and is currently estimated at $413,184, approximately $175 per square foot. 9067 Cedarview Ave is a home located in Ottawa County with nearby schools including Bauerwood Elementary School, Jenison Junior High School, and Jenison High School.
Ownership History
Date
Name
Owned For
Owner Type
Purchase Details
Closed on
Sep 15, 2015
Sold by
Harshberger Brian and Harshberger Jamie
Bought by
Harshberger Brian A and Harshberger Jamie M
Current Estimated Value
Purchase Details
Closed on
May 30, 2008
Sold by
Sparpana Joshua A and Sparpana Alicia J
Bought by
Harshberger Brian and Harshberger Jamie
Home Financials for this Owner
Home Financials are based on the most recent Mortgage that was taken out on this home.
Original Mortgage
$62,000
Interest Rate
6.01%
Mortgage Type
Purchase Money Mortgage
Purchase Details
Closed on
Mar 11, 2005
Sold by
Snip Michael J and Snip Melissa R
Bought by
Snip Michael J and Snip Melissa R
Home Financials for this Owner
Home Financials are based on the most recent Mortgage that was taken out on this home.
Original Mortgage
$161,100
Interest Rate
5.61%
Mortgage Type
Purchase Money Mortgage
Create a Home Valuation Report for This Property
The Home Valuation Report is an in-depth analysis detailing your home's value as well as a comparison with similar homes in the area
Home Values in the Area
Average Home Value in this Area
Purchase History
| Date | Buyer | Sale Price | Title Company |
|---|---|---|---|
| Harshberger Brian A | -- | Attorney | |
| Harshberger Brian | $187,000 | Metropolitan Title Company | |
| Snip Michael J | $179,000 | Lighthouse Title Inc | |
| Snip Michael J | -- | Lighthouse Title Inc |
Source: Public Records
Mortgage History
| Date | Status | Borrower | Loan Amount |
|---|---|---|---|
| Closed | Harshberger Brian | $62,000 | |
| Previous Owner | Snip Michael J | $161,100 |
Source: Public Records
Tax History Compared to Growth
Tax History
| Year | Tax Paid | Tax Assessment Tax Assessment Total Assessment is a certain percentage of the fair market value that is determined by local assessors to be the total taxable value of land and additions on the property. | Land | Improvement |
|---|---|---|---|---|
| 2025 | $3,080 | $172,200 | $0 | $0 |
| 2024 | $2,672 | $167,300 | $0 | $0 |
| 2023 | $2,500 | $136,200 | $0 | $0 |
| 2022 | $2,744 | $124,700 | $0 | $0 |
| 2021 | $2,665 | $123,700 | $0 | $0 |
| 2020 | $2,635 | $121,300 | $0 | $0 |
| 2019 | $2,757 | $113,800 | $0 | $0 |
| 2018 | $2,287 | $103,500 | $0 | $0 |
| 2017 | $2,247 | $99,900 | $0 | $0 |
| 2016 | $2,233 | $94,500 | $0 | $0 |
| 2015 | $2,131 | $96,600 | $0 | $0 |
| 2014 | $2,131 | $85,000 | $0 | $0 |
Source: Public Records
Map
Nearby Homes
- 9001 Victor Ave
- 8938 Cottonwood Dr
- 2483 Willow Creek Ct
- 8237 Greenridge Dr
- 9381 28th Ave Unit PARCEL 2
- 1239 Monte Carlo Dr
- 8163 Greenridge Dr
- 8103 Birchwood Ave
- 1468 Maplewood Dr Unit 9
- 1937 Mulberry Ln
- 8906 Emerado Rd
- 3097 Brayridge Dr
- 3205 Deer Haven Dr
- The Sebastian Plan at Lowing Woods - Designer Series
- The Jamestown Plan at Lowing Woods - Designer Series
- The Rutherford Plan at Lowing Woods - Designer Series
- The Newport Plan at Lowing Woods - Designer Series
- The Crestview Plan at Lowing Woods - Designer Series
- The Birkshire II Plan at Lowing Woods - Designer Series
- The Amber Plan at Lowing Woods - Hometown Series
- 9081 Cedarview Ave
- 9055 Cedarview Ave
- 9068 Victor Ave
- 9084 Victor Ave
- 9052 Victor Ave
- 9041 Cedarview Ave
- 9093 Cedarview Ave
- 9066 Cedarview Ave
- 9080 Cedarview Ave
- 9100 Victor Ave
- 9036 Victor Ave
- 9052 Cedarview Ave
- 9027 Cedarview Ave
- 1975 Crabtree Ln
- 9040 Cedarview Ave
- 1940 Crabtree Ln
- 1965 Crabtree Ln
- 9116 Victor Ave
- 9065 Victor Ave
- 9081 Victor Ave