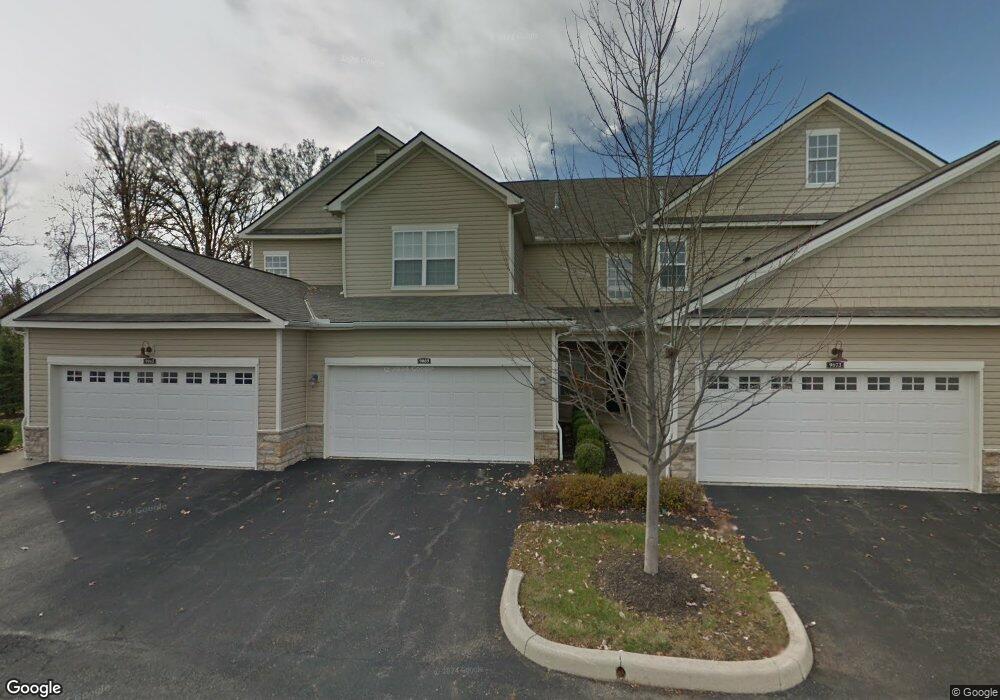
9069 Polaris Lakes Dr Unit 9069 Columbus, OH 43240
Polaris North NeighborhoodEstimated Value: $316,000 - $350,000
2
Beds
2
Baths
1,428
Sq Ft
$231/Sq Ft
Est. Value
About This Home
This home is located at 9069 Polaris Lakes Dr Unit 9069, Columbus, OH 43240 and is currently estimated at $329,701, approximately $230 per square foot. 9069 Polaris Lakes Dr Unit 9069 is a home located in Delaware County with nearby schools including Glen Oak Elementary School, Olentangy Orange Middle School, and Orange High School.
Ownership History
Date
Name
Owned For
Owner Type
Purchase Details
Closed on
Dec 18, 2014
Sold by
Gramelspacher Myron and Gramelspacher Kim L
Bought by
Eee Investments Llc
Current Estimated Value
Purchase Details
Closed on
Jan 6, 2014
Sold by
Eee Investments Llc
Bought by
Gramelspacher Myron
Home Financials for this Owner
Home Financials are based on the most recent Mortgage that was taken out on this home.
Original Mortgage
$143,275
Interest Rate
4.23%
Mortgage Type
New Conventional
Purchase Details
Closed on
Oct 23, 2008
Sold by
Gramelspacher Myron D and Gramelspacher Kim L
Bought by
Eee Investments Llc
Purchase Details
Closed on
Jul 16, 2008
Sold by
The Lakes At Polaris Llc
Bought by
Gramelspacher Myron D and Gramelspacher Kim L
Home Financials for this Owner
Home Financials are based on the most recent Mortgage that was taken out on this home.
Original Mortgage
$150,268
Interest Rate
6.36%
Mortgage Type
Purchase Money Mortgage
Create a Home Valuation Report for This Property
The Home Valuation Report is an in-depth analysis detailing your home's value as well as a comparison with similar homes in the area
Home Values in the Area
Average Home Value in this Area
Purchase History
| Date | Buyer | Sale Price | Title Company |
|---|---|---|---|
| Eee Investments Llc | -- | Chase Title | |
| Gramelspacher Myron | -- | None Available | |
| Eee Investments Llc | -- | Attorney | |
| Gramelspacher Myron D | $187,900 | Talon Group |
Source: Public Records
Mortgage History
| Date | Status | Borrower | Loan Amount |
|---|---|---|---|
| Previous Owner | Gramelspacher Myron | $143,275 | |
| Previous Owner | Gramelspacher Myron D | $150,268 |
Source: Public Records
Tax History Compared to Growth
Tax History
| Year | Tax Paid | Tax Assessment Tax Assessment Total Assessment is a certain percentage of the fair market value that is determined by local assessors to be the total taxable value of land and additions on the property. | Land | Improvement |
|---|---|---|---|---|
| 2024 | $5,165 | $92,790 | $18,730 | $74,060 |
| 2023 | $5,184 | $92,790 | $18,730 | $74,060 |
| 2022 | $4,711 | $68,640 | $15,930 | $52,710 |
| 2021 | $4,738 | $68,640 | $15,930 | $52,710 |
| 2020 | $4,765 | $68,640 | $15,930 | $52,710 |
| 2019 | $3,975 | $59,330 | $12,250 | $47,080 |
| 2018 | $3,992 | $59,330 | $12,250 | $47,080 |
| 2017 | $3,971 | $60,760 | $10,500 | $50,260 |
| 2016 | $4,354 | $60,760 | $10,500 | $50,260 |
| 2015 | $3,990 | $60,760 | $10,500 | $50,260 |
| 2014 | $4,047 | $60,760 | $10,500 | $50,260 |
| 2013 | $4,140 | $60,760 | $10,500 | $50,260 |
Source: Public Records
Map
Nearby Homes
- 9182 Gramford St Unit 9182
- 9146 Gramford St Unit 9146
- 9168 Tahoma St
- 1627 Bristol Commons Place
- 2715 Tucker Trail
- 1746 E Powell Rd
- 8322 Aurora Ct
- 2251 Tucker Trail
- 975 Adara Dr Unit 6975
- 3138 E Powell Rd
- 2216 Reeves Ave
- 3313 Glen Oaks Ct
- 7631 Pleasant Colony Ct
- 1923 Myrtle St
- 2165 Ben Brush Place
- 758 Parkgrove Way Unit 758
- 1520 Aniko Ave
- 738 Parkbluff Way Unit 738
- 8749 Paulden Ct
- 2363 Pleasant Colony Dr
- 9085 Polaris Lakes Dr Unit 9085
- 9081 Polaris Lakes Dr Unit 9081
- 9073 Polaris Lakes Dr Unit 9073
- 9065 Polaris Lakes Dr Unit 9065
- 9073 Polaris Lakes Dr
- 9100 Polaris Lakes Dr Unit 9100
- 9096 Polaris Lakes Dr Unit 9096
- 9092 Polaris Lakes Dr Unit 9092
- 9088 Polaris Lakes Dr Unit 9088
- 9084 Polaris Lakes Dr Unit 9084
- 9080 Polaris Lakes Dr Unit 9080
- 9109 Polaris Lakes Dr Unit 9109
- 9101 Polaris Lakes Dr Unit 9101
- 9065 Polaris Lakes Dr
- 1333 Winningham Ln Unit 1333
- 9113 Polaris Lakes Dr Unit 9113
- 9105 Polaris Lakes Dr Unit 9105
- 9097 Polaris Lakes Dr Unit 9097
- 9093 Polaris Lakes Dr Unit 9093
- 1337 Winningham Ln