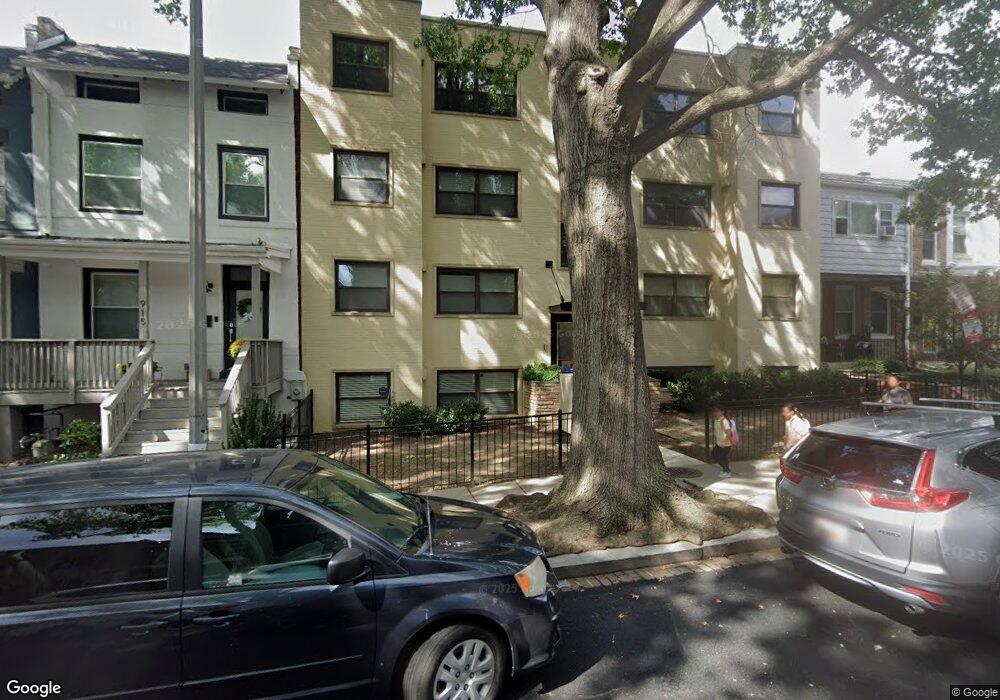
907 Euclid St NW Washington, DC 20001
Pleasant Plains NeighborhoodEstimated Value: $342,000 - $529,000
1
Bed
1
Bath
724
Sq Ft
$580/Sq Ft
Est. Value
About This Home
This home is located at 907 Euclid St NW, Washington, DC 20001 and is currently estimated at $420,244, approximately $580 per square foot. 907 Euclid St NW is a home located in District of Columbia with nearby schools including Tubman Elementary School, Cardozo Education Campus, and Columbia Heights Education Campus.
Ownership History
Date
Name
Owned For
Owner Type
Purchase Details
Closed on
Feb 13, 2020
Sold by
Stoller John D and Stoller Alexandra M
Bought by
Vandenbergh Carrie
Current Estimated Value
Home Financials for this Owner
Home Financials are based on the most recent Mortgage that was taken out on this home.
Original Mortgage
$249,999
Interest Rate
3.72%
Mortgage Type
New Conventional
Purchase Details
Closed on
Nov 30, 2015
Sold by
Power Lindsey
Bought by
Stoller John D and Stoller Alexandera M
Home Financials for this Owner
Home Financials are based on the most recent Mortgage that was taken out on this home.
Original Mortgage
$328,345
Interest Rate
3.83%
Mortgage Type
New Conventional
Purchase Details
Closed on
Feb 25, 2011
Sold by
Ndc 907 Euclid Llc
Bought by
Power Lindsey
Home Financials for this Owner
Home Financials are based on the most recent Mortgage that was taken out on this home.
Original Mortgage
$229,042
Interest Rate
4.5%
Mortgage Type
FHA
Create a Home Valuation Report for This Property
The Home Valuation Report is an in-depth analysis detailing your home's value as well as a comparison with similar homes in the area
Home Values in the Area
Average Home Value in this Area
Purchase History
| Date | Buyer | Sale Price | Title Company |
|---|---|---|---|
| Vandenbergh Carrie | $399,999 | Federal Title & Escrow Co | |
| Stoller John D | $338,500 | None Available | |
| Power Lindsey | $235,000 | -- |
Source: Public Records
Mortgage History
| Date | Status | Borrower | Loan Amount |
|---|---|---|---|
| Open | Vandenbergh Carrie | $249,999 | |
| Previous Owner | Stoller John D | $328,345 | |
| Previous Owner | Power Lindsey | $229,042 |
Source: Public Records
Tax History Compared to Growth
Tax History
| Year | Tax Paid | Tax Assessment Tax Assessment Total Assessment is a certain percentage of the fair market value that is determined by local assessors to be the total taxable value of land and additions on the property. | Land | Improvement |
|---|---|---|---|---|
| 2024 | $2,897 | $443,010 | $132,900 | $310,110 |
| 2023 | $2,851 | $434,140 | $130,240 | $303,900 |
| 2022 | $2,952 | $443,550 | $133,060 | $310,490 |
| 2021 | $2,697 | $406,960 | $122,090 | $284,870 |
| 2020 | $2,714 | $394,990 | $118,500 | $276,490 |
| 2019 | $2,522 | $371,550 | $111,460 | $260,090 |
| 2018 | $2,422 | $367,670 | $0 | $0 |
| 2017 | $2,209 | $332,360 | $0 | $0 |
| 2016 | $2,216 | $332,360 | $0 | $0 |
| 2015 | $2,035 | $321,830 | $0 | $0 |
| 2014 | $1,860 | $301,880 | $0 | $0 |
Source: Public Records
Map
Nearby Homes
- 825 Euclid St NW
- 733 Euclid St NW Unit 303
- 733 Euclid St NW Unit 201
- 733 Euclid St NW Unit 101
- 733 Euclid St NW Unit 302
- 2623 Sherman Ave NW
- 723 Euclid St NW
- 771 Fairmont St NW
- 1030 Fairmont St NW Unit T2
- 1030 Fairmont St NW Unit 202
- 774 Girard St NW Unit 7W
- 2707 11th St NW
- 749 Girard St NW
- 743 Girard St NW
- 1117 Clifton St NW
- 760 Gresham Place NW
- 758 Gresham Place NW
- 2805 11th St NW
- 2812 Georgia Ave NW Unit 6
- 1133 Fairmont St NW
- 907 Euclid St NW
- 907 Euclid St NW Unit 303
- 907 Euclid St NW Unit 302
- 907 Euclid St NW Unit 301
- 907 Euclid St NW
- 907 Euclid St NW
- 907 Euclid St NW
- 907 Euclid St NW
- 907 Euclid St NW Unit 104
- 907 Euclid St NW Unit 103
- 907 Euclid St NW Unit 101
- 907 Euclid St NW Unit B2
- 907 Euclid St NW
- 907 Euclid St NW Unit 304
- 907 Euclid St NW Unit 204
- 907 Euclid St NW Unit 201
- 907 Euclid St NW Unit 102
- 907 Euclid St NW Unit B02
- 921 Euclid St NW
- 915 Euclid St NW