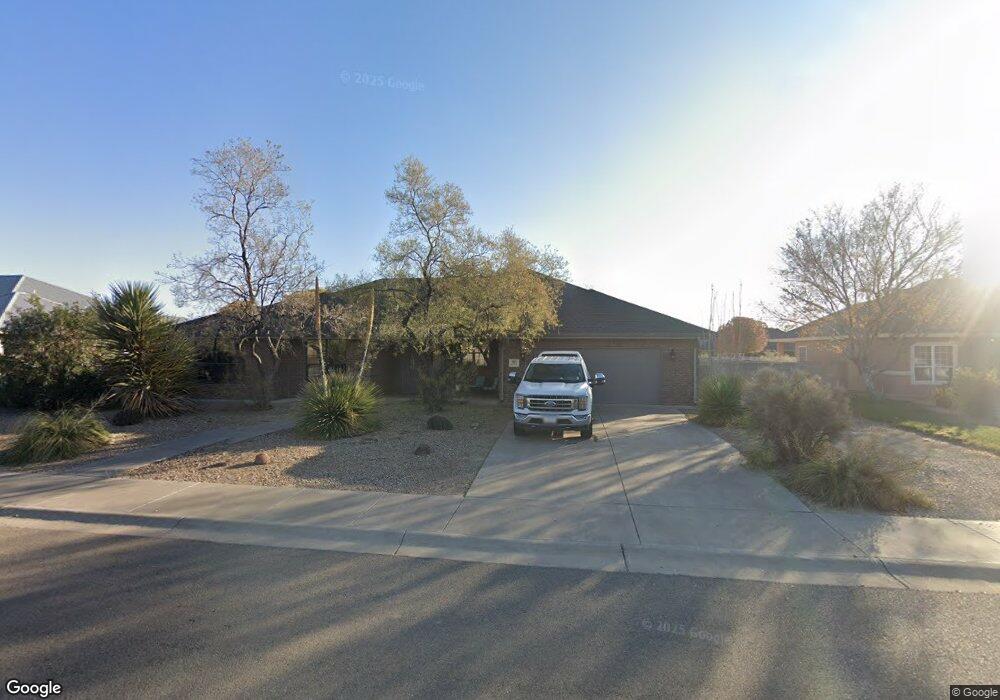
907 Le Ann Dr Roswell, NM 88201
Estimated Value: $192,000 - $343,000
4
Beds
2
Baths
2,317
Sq Ft
$118/Sq Ft
Est. Value
About This Home
This home is located at 907 Le Ann Dr, Roswell, NM 88201 and is currently estimated at $273,809, approximately $118 per square foot. 907 Le Ann Dr is a home located in Chaves County with nearby schools including Military Heights Elementary School, Berrendo Middle School, and Goddard High School.
Ownership History
Date
Name
Owned For
Owner Type
Purchase Details
Closed on
Apr 27, 2018
Sold by
Roberts Kenneth S
Bought by
Roberts Craig E and Roberts Catherine B
Current Estimated Value
Purchase Details
Closed on
Jan 13, 2011
Sold by
Roberts Kenneth S
Bought by
Roberts Kenneth S and Roberts Craig E
Home Financials for this Owner
Home Financials are based on the most recent Mortgage that was taken out on this home.
Original Mortgage
$168,000
Outstanding Balance
$114,865
Interest Rate
4.84%
Mortgage Type
New Conventional
Estimated Equity
$158,944
Purchase Details
Closed on
Oct 7, 2008
Sold by
Arnold Christopher A
Bought by
Roberts Kenneth S and Roberts Craig E
Home Financials for this Owner
Home Financials are based on the most recent Mortgage that was taken out on this home.
Original Mortgage
$168,000
Interest Rate
6%
Mortgage Type
New Conventional
Purchase Details
Closed on
Feb 7, 2008
Sold by
Dennis William C and Dennis Carol
Bought by
Arnold Christopher A
Create a Home Valuation Report for This Property
The Home Valuation Report is an in-depth analysis detailing your home's value as well as a comparison with similar homes in the area
Home Values in the Area
Average Home Value in this Area
Purchase History
| Date | Buyer | Sale Price | Title Company |
|---|---|---|---|
| Roberts Craig E | -- | None Available | |
| Roberts Kenneth S | -- | Fidelity National Title Of N | |
| Roberts Kenneth S | -- | Fiedelity National Title Of | |
| Roberts Kenneth S | -- | Lawyers Title | |
| Arnold Christopher A | -- | Landamerica Lawyers Title |
Source: Public Records
Mortgage History
| Date | Status | Borrower | Loan Amount |
|---|---|---|---|
| Open | Roberts Kenneth S | $168,000 | |
| Closed | Roberts Kenneth S | $168,000 |
Source: Public Records
Tax History Compared to Growth
Tax History
| Year | Tax Paid | Tax Assessment Tax Assessment Total Assessment is a certain percentage of the fair market value that is determined by local assessors to be the total taxable value of land and additions on the property. | Land | Improvement |
|---|---|---|---|---|
| 2025 | -- | $98,654 | $10,333 | $88,321 |
| 2024 | $2,605 | $95,780 | $10,333 | $85,447 |
| 2023 | $2,611 | $92,991 | $10,333 | $82,658 |
| 2022 | $2,532 | $91,059 | $10,288 | $80,771 |
| 2021 | $0 | $88,407 | $10,257 | $78,150 |
| 2020 | $2,440 | $85,833 | $10,065 | $75,768 |
| 2019 | $2,365 | $83,332 | $9,659 | $73,673 |
| 2018 | $2,292 | $80,905 | $9,333 | $71,572 |
| 2017 | $2,255 | $80,304 | $9,333 | $70,971 |
| 2016 | $2,265 | $81,491 | $9,333 | $72,158 |
| 2015 | $2,449 | $80,078 | $9,333 | $70,745 |
| 2014 | $4,780 | $78,148 | $9,333 | $68,815 |
Source: Public Records
Map
Nearby Homes
- 906 Pearson Dr
- 1006 de Bremond Dr
- 1201 Saunders Dr
- 805 Mason Dr
- 3207 Dow Dr
- 3203 Highland Rd
- 3109 Riverside Dr
- 2803 W 8th St
- 708 N Sycamore Ave
- 2607 Riverside Dr
- 307 N Sycamore Ave
- 00002 N Sycamore Ave
- 00001 N Sycamore Ave
- 205 Pima Dr
- 00 S Balsam Ave
- 7 Oak Dr
- 4608 W 2nd St
- 2116 W 1st St
- 103 Avenue D
- 6399 W 2nd St