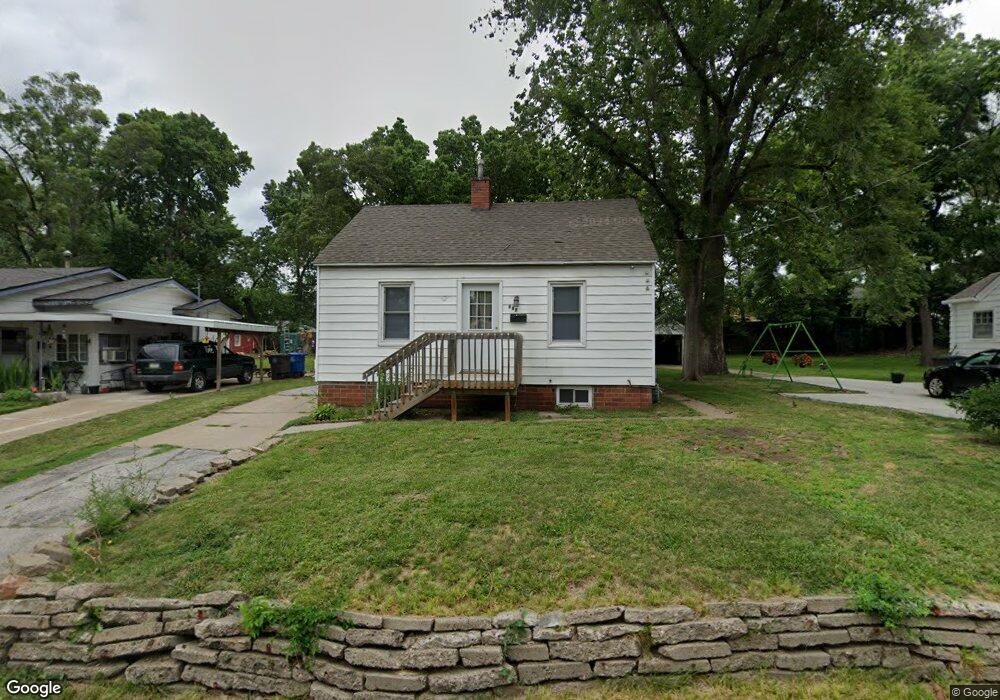
907 Leach Ave Des Moines, IA 50315
Watrous South NeighborhoodEstimated Value: $111,411 - $124,000
1
Bed
1
Bath
572
Sq Ft
$206/Sq Ft
Est. Value
About This Home
This home is located at 907 Leach Ave, Des Moines, IA 50315 and is currently estimated at $117,853, approximately $206 per square foot. 907 Leach Ave is a home located in Polk County with nearby schools including Park Avenue Elementary School, Brody Middle School, and Lincoln High School.
Ownership History
Date
Name
Owned For
Owner Type
Purchase Details
Closed on
Nov 28, 2017
Sold by
Boyer Charles and James B Nutter & Co
Bought by
Dubuque Street Properties Lc
Current Estimated Value
Purchase Details
Closed on
Sep 2, 2005
Sold by
Muto Co
Bought by
Boyer John M
Home Financials for this Owner
Home Financials are based on the most recent Mortgage that was taken out on this home.
Original Mortgage
$51,205
Interest Rate
5.89%
Mortgage Type
Fannie Mae Freddie Mac
Create a Home Valuation Report for This Property
The Home Valuation Report is an in-depth analysis detailing your home's value as well as a comparison with similar homes in the area
Home Values in the Area
Average Home Value in this Area
Purchase History
| Date | Buyer | Sale Price | Title Company |
|---|---|---|---|
| Dubuque Street Properties Lc | $17,600 | None Available | |
| Boyer John M | $53,500 | -- |
Source: Public Records
Mortgage History
| Date | Status | Borrower | Loan Amount |
|---|---|---|---|
| Previous Owner | Boyer John M | $51,205 |
Source: Public Records
Tax History Compared to Growth
Tax History
| Year | Tax Paid | Tax Assessment Tax Assessment Total Assessment is a certain percentage of the fair market value that is determined by local assessors to be the total taxable value of land and additions on the property. | Land | Improvement |
|---|---|---|---|---|
| 2025 | $896 | $99,300 | $27,200 | $72,100 |
| 2024 | $896 | $45,500 | $24,000 | $21,500 |
| 2023 | $730 | $89,300 | $24,000 | $65,300 |
| 2022 | $726 | $74,800 | $20,400 | $54,400 |
| 2021 | $654 | $74,800 | $20,400 | $54,400 |
| 2020 | $1,814 | $70,000 | $19,100 | $50,900 |
| 2019 | $1,010 | $70,000 | $19,100 | $50,900 |
| 2018 | $1,300 | $37,600 | $16,700 | $20,900 |
| 2017 | $1,198 | $57,600 | $16,700 | $40,900 |
| 2016 | $1,162 | $52,800 | $15,000 | $37,800 |
| 2015 | $1,162 | $52,800 | $15,000 | $37,800 |
| 2014 | $1,128 | $53,000 | $14,800 | $38,200 |
Source: Public Records
Map
Nearby Homes