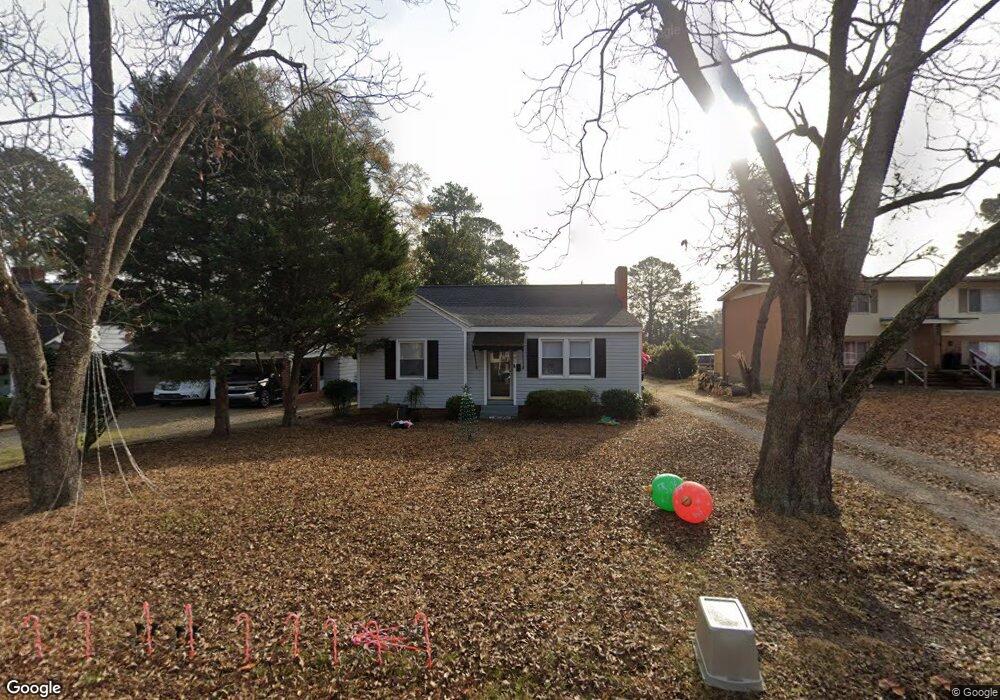
907 S 2nd St Smithfield, NC 27577
Estimated Value: $190,000 - $227,854
2
Beds
1
Bath
1,135
Sq Ft
$186/Sq Ft
Est. Value
About This Home
This home is located at 907 S 2nd St, Smithfield, NC 27577 and is currently estimated at $210,964, approximately $185 per square foot. 907 S 2nd St is a home located in Johnston County with nearby schools including South Smithfield Elementary School, Smithfield Middle School, and Smithfield-Selma High School.
Ownership History
Date
Name
Owned For
Owner Type
Purchase Details
Closed on
Feb 27, 2023
Sold by
Darrell Keith Christopher and Katheri Sara
Bought by
Hachez Jessica
Current Estimated Value
Home Financials for this Owner
Home Financials are based on the most recent Mortgage that was taken out on this home.
Original Mortgage
$209,500
Outstanding Balance
$202,887
Interest Rate
6.1%
Mortgage Type
New Conventional
Estimated Equity
$8,077
Purchase Details
Closed on
Mar 1, 2021
Sold by
Keith Amy S
Bought by
Keith Christopher D
Purchase Details
Closed on
May 31, 2011
Sold by
Ragsdale Mary Foy
Bought by
Keith Christopher D and Keith Amy S
Purchase Details
Closed on
Feb 13, 2004
Sold by
Ragsdale Mary Foy
Bought by
Heard Brenda C
Purchase Details
Closed on
Nov 8, 2002
Sold by
Heard Brenda C
Bought by
Harris Bryan H
Create a Home Valuation Report for This Property
The Home Valuation Report is an in-depth analysis detailing your home's value as well as a comparison with similar homes in the area
Home Values in the Area
Average Home Value in this Area
Purchase History
| Date | Buyer | Sale Price | Title Company |
|---|---|---|---|
| Hachez Jessica | $209,500 | -- | |
| Keith Christopher D | -- | None Available | |
| Keith Christopher D | $65,000 | None Available | |
| Heard Brenda C | $96,000 | -- | |
| Harris Bryan H | $85,000 | -- |
Source: Public Records
Mortgage History
| Date | Status | Borrower | Loan Amount |
|---|---|---|---|
| Open | Hachez Jessica | $209,500 |
Source: Public Records
Tax History
| Year | Tax Paid | Tax Assessment Tax Assessment Total Assessment is a certain percentage of the fair market value that is determined by local assessors to be the total taxable value of land and additions on the property. | Land | Improvement |
|---|---|---|---|---|
| 2025 | $2,003 | $206,500 | $80,000 | $126,500 |
| 2024 | $1,371 | $110,580 | $60,000 | $50,580 |
| 2023 | $1,393 | $110,580 | $60,000 | $50,580 |
| 2022 | $1,438 | $110,580 | $60,000 | $50,580 |
| 2021 | $1,438 | $110,580 | $60,000 | $50,580 |
| 2020 | $1,471 | $110,580 | $60,000 | $50,580 |
| 2019 | $1,471 | $110,580 | $60,000 | $50,580 |
| 2018 | $1,078 | $79,850 | $30,160 | $49,690 |
| 2017 | $1,078 | $79,850 | $30,160 | $49,690 |
| 2016 | $1,078 | $79,850 | $30,160 | $49,690 |
| 2014 | $1,078 | $79,850 | $30,160 | $49,690 |
Source: Public Records
Map
Nearby Homes
Your Personal Tour Guide
Ask me questions while you tour the home.