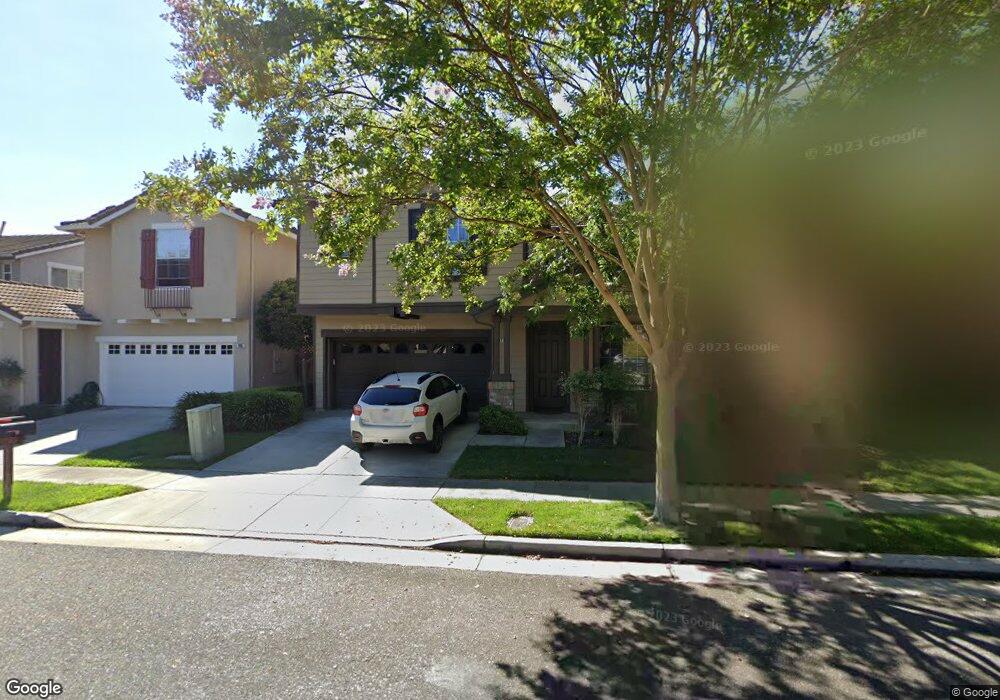
907 Sunbonnet Loop San Jose, CA 95125
South San Jose NeighborhoodEstimated Value: $1,745,250 - $1,880,000
3
Beds
3
Baths
2,069
Sq Ft
$881/Sq Ft
Est. Value
About This Home
This home is located at 907 Sunbonnet Loop, San Jose, CA 95125 and is currently estimated at $1,822,563, approximately $880 per square foot. 907 Sunbonnet Loop is a home located in Santa Clara County with nearby schools including Canoas Elementary School, John Muir Middle School, and Gunderson High School.
Ownership History
Date
Name
Owned For
Owner Type
Purchase Details
Closed on
Jun 5, 2022
Sold by
Mu Tian
Bought by
Tian Family Trust
Current Estimated Value
Purchase Details
Closed on
Jun 11, 2013
Sold by
Tian Mu and Wu Lan
Bought by
Wu Lan and Tian Mu
Home Financials for this Owner
Home Financials are based on the most recent Mortgage that was taken out on this home.
Original Mortgage
$347,000
Interest Rate
3.12%
Mortgage Type
New Conventional
Purchase Details
Closed on
Feb 11, 2000
Sold by
Kaufman & Broad South Bay Inc
Bought by
Tian Mu and Wu Lan
Home Financials for this Owner
Home Financials are based on the most recent Mortgage that was taken out on this home.
Original Mortgage
$354,050
Interest Rate
7.75%
Create a Home Valuation Report for This Property
The Home Valuation Report is an in-depth analysis detailing your home's value as well as a comparison with similar homes in the area
Home Values in the Area
Average Home Value in this Area
Purchase History
| Date | Buyer | Sale Price | Title Company |
|---|---|---|---|
| Tian Family Trust | -- | None Listed On Document | |
| Wu Lan | -- | Old Republic Title Company | |
| Tian Mu | $443,000 | First American Title Guarant |
Source: Public Records
Mortgage History
| Date | Status | Borrower | Loan Amount |
|---|---|---|---|
| Previous Owner | Wu Lan | $347,000 | |
| Previous Owner | Tian Mu | $354,050 |
Source: Public Records
Tax History Compared to Growth
Tax History
| Year | Tax Paid | Tax Assessment Tax Assessment Total Assessment is a certain percentage of the fair market value that is determined by local assessors to be the total taxable value of land and additions on the property. | Land | Improvement |
|---|---|---|---|---|
| 2025 | $8,813 | $649,354 | $307,388 | $341,966 |
| 2024 | $8,813 | $636,622 | $301,361 | $335,261 |
| 2023 | $8,628 | $624,140 | $295,452 | $328,688 |
| 2022 | $8,634 | $611,903 | $289,659 | $322,244 |
| 2021 | $8,437 | $599,906 | $283,980 | $315,926 |
| 2020 | $8,229 | $593,756 | $281,069 | $312,687 |
| 2019 | $8,045 | $582,114 | $275,558 | $306,556 |
| 2018 | $7,957 | $570,701 | $270,155 | $300,546 |
| 2017 | $7,888 | $559,511 | $264,858 | $294,653 |
| 2016 | $7,719 | $548,541 | $259,665 | $288,876 |
| 2015 | $7,664 | $540,302 | $255,765 | $284,537 |
| 2014 | $7,220 | $529,719 | $250,755 | $278,964 |
Source: Public Records
Map
Nearby Homes
- 2871 Rubino Cir
- 940 Sunbonnet Loop
- 2829 Rubino Cir
- 817 Pitkin Loop
- 903 Lanewood Dr
- 921 Kingfisher Dr
- 3066 Nattinger Ln
- 3048 Brunetti Way Unit 47
- 3074 Pearl Ave
- 1202 Foxworthy Ave
- 2633 Villa Cortona Way Unit E1
- 1027 Shenandoah Dr
- 707 Mill Stream Dr Unit 707
- 707 Mill Stream Dr
- 1028 Pascoe Ave
- 1267 Hillsdale Ave
- 1256 Hillsdale Ave
- 3761 Thousand Oaks Dr
- 2296 Almaden Rd Unit B
- 259 Mountain Springs Dr Unit 259
- 905 Sunbonnet Loop
- 909 Sunbonnet Loop
- 963 Sunbonnet Loop
- 965 Sunbonnet Loop
- 961 Sunbonnet Loop
- 911 Sunbonnet Loop
- 903 Sunbonnet Loop
- 967 Sunbonnet Loop
- 959 Sunbonnet Loop
- 2775 Sunbonnet Ct
- 2774 Sunbonnet Ct
- 913 Sunbonnet Loop
- 901 Sunbonnet Loop
- 969 Sunbonnet Loop
- 957 Sunbonnet Loop
- 2769 Sunbonnet Ct
- 2768 Sunbonnet Ct
- 2776 Bungalow Ct
- 2946 Rubino Cir
- 915 Sunbonnet Loop