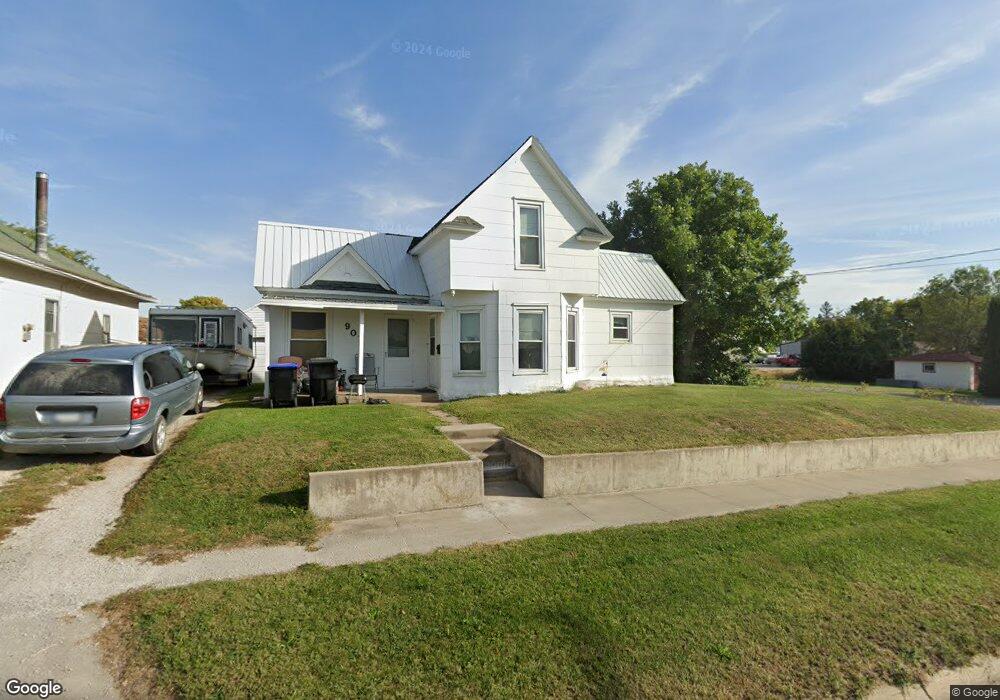
907 W 3rd St Vinton, IA 52349
Estimated Value: $63,479 - $88,000
2
Beds
1
Bath
973
Sq Ft
$82/Sq Ft
Est. Value
About This Home
This home is located at 907 W 3rd St, Vinton, IA 52349 and is currently estimated at $79,493, approximately $81 per square foot. 907 W 3rd St is a home with nearby schools including Tilford Elementary School, Shellsburg Elementary School, and Vinton-Shellsburg Middle School.
Ownership History
Date
Name
Owned For
Owner Type
Purchase Details
Closed on
Oct 17, 2008
Sold by
Welbes Joann E
Bought by
Michael Alan R and Michael Cindy M
Current Estimated Value
Home Financials for this Owner
Home Financials are based on the most recent Mortgage that was taken out on this home.
Original Mortgage
$75,000
Outstanding Balance
$48,685
Interest Rate
5.94%
Mortgage Type
Future Advance Clause Open End Mortgage
Estimated Equity
$30,808
Create a Home Valuation Report for This Property
The Home Valuation Report is an in-depth analysis detailing your home's value as well as a comparison with similar homes in the area
Home Values in the Area
Average Home Value in this Area
Purchase History
| Date | Buyer | Sale Price | Title Company |
|---|---|---|---|
| Michael Alan R | $27,500 | None Available |
Source: Public Records
Mortgage History
| Date | Status | Borrower | Loan Amount |
|---|---|---|---|
| Open | Michael Alan R | $75,000 |
Source: Public Records
Tax History Compared to Growth
Tax History
| Year | Tax Paid | Tax Assessment Tax Assessment Total Assessment is a certain percentage of the fair market value that is determined by local assessors to be the total taxable value of land and additions on the property. | Land | Improvement |
|---|---|---|---|---|
| 2025 | $752 | $44,200 | $7,900 | $36,300 |
| 2024 | $752 | $40,100 | $7,700 | $32,400 |
| 2023 | $742 | $40,100 | $7,700 | $32,400 |
| 2022 | $610 | $34,500 | $6,200 | $28,300 |
| 2021 | $610 | $27,600 | $6,200 | $21,400 |
| 2020 | $590 | $27,300 | $4,600 | $22,700 |
| 2019 | $720 | $27,300 | $4,600 | $22,700 |
| 2018 | $698 | $32,800 | $4,200 | $28,600 |
| 2017 | $672 | $32,800 | $4,200 | $28,600 |
| 2016 | $660 | $30,600 | $3,900 | $26,700 |
| 2015 | $660 | $30,600 | $3,900 | $26,700 |
| 2014 | $642 | $29,700 | $0 | $0 |
Source: Public Records
Map
Nearby Homes