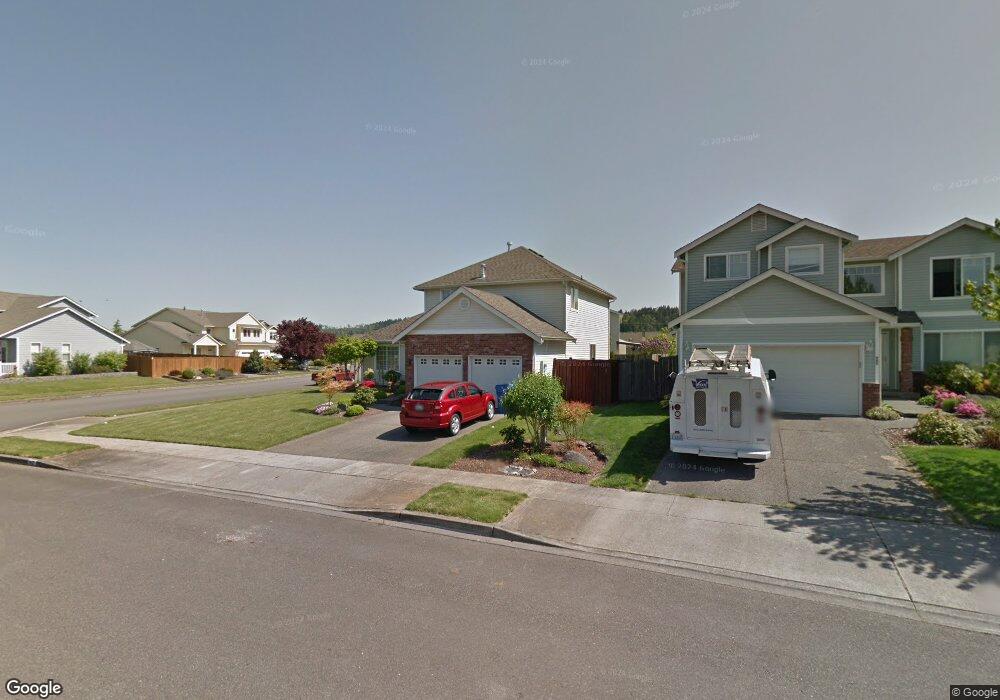
907 Williams St NW Orting, WA 98360
Estimated Value: $530,000 - $541,000
4
Beds
2
Baths
1,737
Sq Ft
$308/Sq Ft
Est. Value
About This Home
This home is located at 907 Williams St NW, Orting, WA 98360 and is currently estimated at $535,296, approximately $308 per square foot. 907 Williams St NW is a home located in Pierce County with nearby schools including Orting Elementary School, Ptarmigan Ridge Elementary School, and Orting Middle School.
Ownership History
Date
Name
Owned For
Owner Type
Purchase Details
Closed on
Aug 20, 2021
Sold by
Norby Stephanie L and Norby David L
Bought by
Harden Sonja M and Harden Steven D
Current Estimated Value
Purchase Details
Closed on
Jun 5, 2009
Sold by
Harden Sonja M and Harden Steven D
Bought by
Nordby Stephanie L and Nordby David L
Home Financials for this Owner
Home Financials are based on the most recent Mortgage that was taken out on this home.
Original Mortgage
$155,700
Interest Rate
4.76%
Mortgage Type
Purchase Money Mortgage
Purchase Details
Closed on
Sep 27, 2002
Sold by
Capstone Homes Inc
Bought by
Nordby David L and Nordby Stephanie L
Home Financials for this Owner
Home Financials are based on the most recent Mortgage that was taken out on this home.
Original Mortgage
$165,305
Interest Rate
6.16%
Mortgage Type
FHA
Create a Home Valuation Report for This Property
The Home Valuation Report is an in-depth analysis detailing your home's value as well as a comparison with similar homes in the area
Home Values in the Area
Average Home Value in this Area
Purchase History
| Date | Buyer | Sale Price | Title Company |
|---|---|---|---|
| Harden Sonja M | -- | None Available | |
| Nordby Stephanie L | -- | Northpoint Escrow & Title Ll | |
| Nordby David L | $167,900 | Transnation Title Insurance |
Source: Public Records
Mortgage History
| Date | Status | Borrower | Loan Amount |
|---|---|---|---|
| Previous Owner | Nordby Stephanie L | $155,700 | |
| Previous Owner | Nordby David L | $165,305 |
Source: Public Records
Tax History Compared to Growth
Tax History
| Year | Tax Paid | Tax Assessment Tax Assessment Total Assessment is a certain percentage of the fair market value that is determined by local assessors to be the total taxable value of land and additions on the property. | Land | Improvement |
|---|---|---|---|---|
| 2025 | $3,914 | $456,900 | $203,300 | $253,600 |
| 2024 | $3,914 | $451,000 | $203,300 | $247,700 |
| 2023 | $3,914 | $422,600 | $195,200 | $227,400 |
| 2022 | $3,685 | $440,400 | $195,200 | $245,200 |
| 2021 | $3,804 | $314,200 | $117,100 | $197,100 |
| 2019 | $3,416 | $282,700 | $99,300 | $183,400 |
| 2018 | $3,533 | $265,100 | $86,600 | $178,500 |
| 2017 | $3,285 | $234,400 | $69,500 | $164,900 |
| 2016 | $3,038 | $194,800 | $54,300 | $140,500 |
| 2014 | $2,503 | $181,400 | $48,600 | $132,800 |
| 2013 | $2,503 | $150,400 | $38,100 | $112,300 |
Source: Public Records
Map
Nearby Homes
- 1205 Boatman Ave NW
- 1113 Ofarrell Ln NW
- 1005 van Ogle Ln NW
- 1105 Sigafoos Ave NW
- 1108 Sigafoos Ave NW
- 1208 Sigafoos Ave NW
- 1002 O'Farrell Ln NW
- 1114 Ross Ave NW
- 912 O'Farrell Ln NW
- 1309 Riddell Ave NE
- 15405 148th Avenue Ct E
- 116 Mazza St NE
- 1415 Riddell Ave NE
- 812 Sigafoos Ave NW
- 1503 Riddell Ave NE
- 15301 147th Ave E
- 1324 Hansberry Ave NE
- 1605 Riddell Ave NE
- 114 Weaver St NE
- 1602 Riddell Ave NE
- 905 Williams St NW
- 410 Anderson St NW
- 903 Williams St NW
- 1001 Williams St NW
- 408 Anderson St NW
- 901 Williams St NW
- 409 Ozzie St NW
- 407 Ozzie St NW
- 908 Williams St NW
- 409 Anderson St NW
- 1002 Williams St NW
- 906 Williams St NW
- 1003 Williams St NW
- 406 Anderson St NW
- 405 Ozzie St NW
- 904 Williams St NW
- 402 Anderson St NW
- 1004 Williams St NW
- 407 Anderson St NW
- 1005 Williams St NW