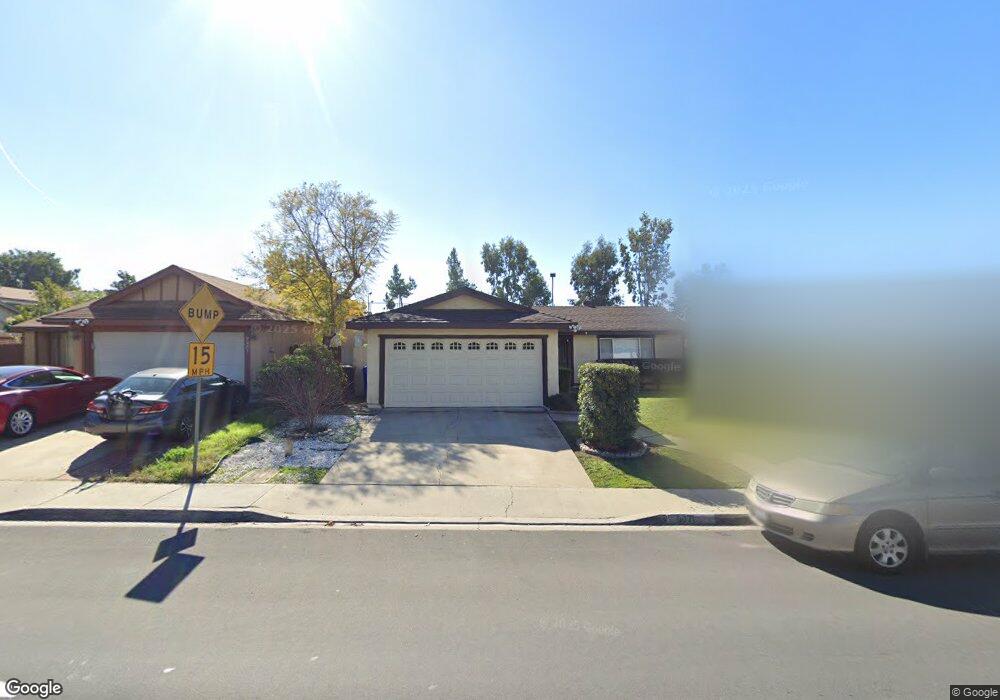
9071 Capricorn Way San Diego, CA 92126
Mira Mesa NeighborhoodEstimated Value: $778,000 - $918,000
2
Beds
2
Baths
1,008
Sq Ft
$859/Sq Ft
Est. Value
About This Home
This home is located at 9071 Capricorn Way, San Diego, CA 92126 and is currently estimated at $866,231, approximately $859 per square foot. 9071 Capricorn Way is a home located in San Diego County with nearby schools including Hage Elementary School, Wangenheim Middle School, and Mira Mesa High School.
Ownership History
Date
Name
Owned For
Owner Type
Purchase Details
Closed on
Apr 23, 2003
Sold by
Tumminelli Chris and Tumminelli Karen
Bought by
Nguyen Thuan Kim and Nguyen Thuy Hang Hoang
Current Estimated Value
Home Financials for this Owner
Home Financials are based on the most recent Mortgage that was taken out on this home.
Original Mortgage
$254,400
Outstanding Balance
$109,289
Interest Rate
5.75%
Mortgage Type
Purchase Money Mortgage
Estimated Equity
$756,942
Purchase Details
Closed on
Jun 4, 1999
Sold by
Delcasale Robert and Delcasale Arlene
Bought by
Tumminelli Chris and Tumminelli Karen
Home Financials for this Owner
Home Financials are based on the most recent Mortgage that was taken out on this home.
Original Mortgage
$172,380
Interest Rate
7.05%
Mortgage Type
VA
Purchase Details
Closed on
Mar 29, 1989
Create a Home Valuation Report for This Property
The Home Valuation Report is an in-depth analysis detailing your home's value as well as a comparison with similar homes in the area
Home Values in the Area
Average Home Value in this Area
Purchase History
| Date | Buyer | Sale Price | Title Company |
|---|---|---|---|
| Nguyen Thuan Kim | -- | Southland Title | |
| Tumminelli Chris | $169,000 | Chicago Title Co | |
| -- | $137,000 | -- |
Source: Public Records
Mortgage History
| Date | Status | Borrower | Loan Amount |
|---|---|---|---|
| Open | Nguyen Thuan Kim | $254,400 | |
| Previous Owner | Tumminelli Chris | $172,380 | |
| Closed | Nguyen Thuan Kim | $31,800 |
Source: Public Records
Tax History Compared to Growth
Tax History
| Year | Tax Paid | Tax Assessment Tax Assessment Total Assessment is a certain percentage of the fair market value that is determined by local assessors to be the total taxable value of land and additions on the property. | Land | Improvement |
|---|---|---|---|---|
| 2025 | $5,512 | $460,549 | $347,587 | $112,962 |
| 2024 | $5,512 | $451,520 | $340,772 | $110,748 |
| 2023 | $5,388 | $442,668 | $334,091 | $108,577 |
| 2022 | $5,242 | $433,990 | $327,541 | $106,449 |
| 2021 | $5,204 | $425,481 | $321,119 | $104,362 |
| 2020 | $5,140 | $421,119 | $317,827 | $103,292 |
| 2019 | $5,047 | $412,863 | $311,596 | $101,267 |
| 2018 | $4,718 | $404,769 | $305,487 | $99,282 |
| 2017 | $4,601 | $396,834 | $299,498 | $97,336 |
| 2016 | $4,526 | $389,054 | $293,626 | $95,428 |
| 2015 | $4,458 | $383,211 | $289,216 | $93,995 |
| 2014 | $4,261 | $365,000 | $276,000 | $89,000 |
Source: Public Records
Map
Nearby Homes
- 9068 Kirby Ct
- 11394 Pegasus Ave
- 11368 Squamish Rd
- 11575 Westview Pkwy
- 11336 Camarosa Cir
- 8943 Calliandra Rd
- 8667 Cetus Rd
- 11799 Westview Pkwy
- 8574 Summerdale Rd Unit 148
- 11377 Volans St
- 11187 Kelowna Rd Unit 76
- 11901 Westview Pkwy
- 8595 Summerdale Rd Unit 170
- 10770 Black Mountain Rd
- 9005 Ticket St
- 11358 Vela Dr
- 8468 Calle Morelos
- 10853 Westonhill Dr
- 8761 Menkar Rd
- 11034 Sagittarius Rd
- 9081 Capricorn Way
- 9061 Capricorn Way
- 9053 Capricorn Way
- 9089 Capricorn Way
- 9068 Capricorn Way
- 9060 Capricorn Way
- 9043 Capricorn Way
- 11178 Crater Dr
- 9099 Capricorn Way
- 9078 Capricorn Way
- 9050 Capricorn Way
- 11166 Crater Dr
- 9088 Capricorn Way
- 9033 Capricorn Way
- 9040 Capricorn Way
- 9096 Capricorn Way
- 11154 Crater Dr
- 11205 Dalby Place
- 11204 Dalby Place
- 9032 Capricorn Way