Estimated Value: $538,000 - $578,426
3
Beds
2
Baths
1,574
Sq Ft
$351/Sq Ft
Est. Value
About This Home
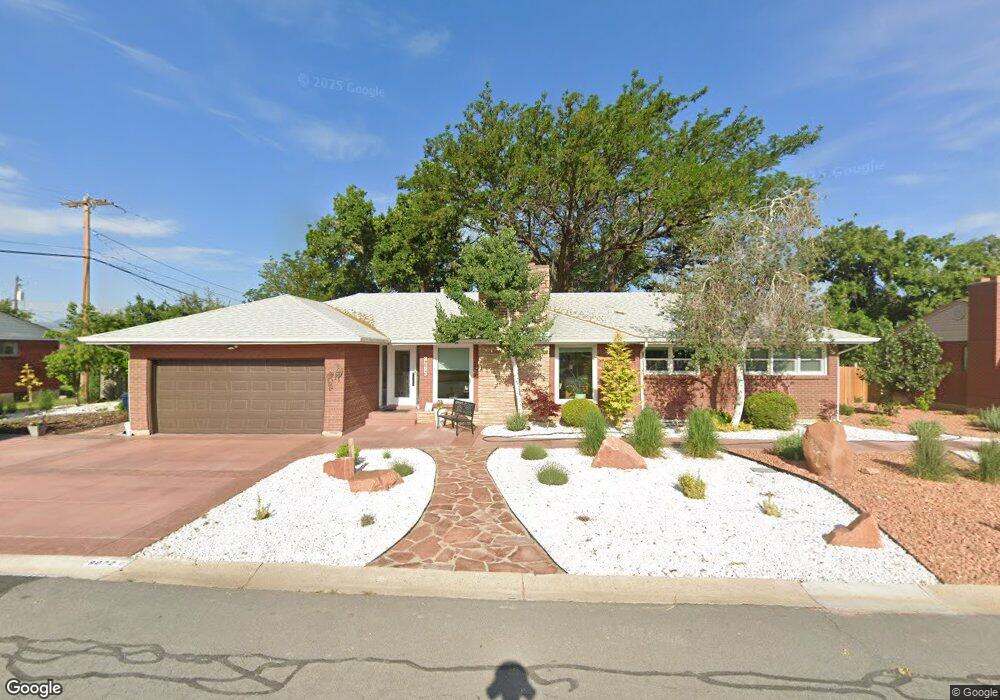
This home is located at 9072 S 260 E, Sandy, UT 84070 and is currently estimated at $553,107, approximately $351 per square foot. 9072 S 260 E is a home located in Salt Lake County with nearby schools including Sandy Elementary School, Mount Jordan Middle School, and Jordan High.
Ownership History
Date
Name
Owned For
Owner Type
Purchase Details
Closed on
Sep 23, 2020
Sold by
Larsen Darren H and Soriano Maria M
Bought by
Larsen Darren Howard and Soriano Maria Margarita
Current Estimated Value
Purchase Details
Closed on
Aug 17, 2001
Sold by
Salmon D Gale
Bought by
Larsen Darren and Soriano Maria
Home Financials for this Owner
Home Financials are based on the most recent Mortgage that was taken out on this home.
Original Mortgage
$80,000
Interest Rate
6.74%
Create a Home Valuation Report for This Property
The Home Valuation Report is an in-depth analysis detailing your home's value as well as a comparison with similar homes in the area
Home Values in the Area
Average Home Value in this Area
Purchase History
| Date | Buyer | Sale Price | Title Company |
|---|---|---|---|
| Larsen Darren Howard | -- | None Available | |
| Larsen Darren | -- | First American Title |
Source: Public Records
Mortgage History
| Date | Status | Borrower | Loan Amount |
|---|---|---|---|
| Previous Owner | Larsen Darren | $80,000 |
Source: Public Records
Tax History
| Year | Tax Paid | Tax Assessment Tax Assessment Total Assessment is a certain percentage of the fair market value that is determined by local assessors to be the total taxable value of land and additions on the property. | Land | Improvement |
|---|---|---|---|---|
| 2025 | -- | $538,500 | $142,800 | $395,700 |
| 2024 | -- | $512,500 | $135,700 | $376,800 |
| 2023 | $2,701 | $498,100 | $129,000 | $369,100 |
| 2022 | $0 | $471,300 | $126,500 | $344,800 |
| 2021 | $3,074 | $366,000 | $97,900 | $268,100 |
| 2020 | $2,257 | $326,400 | $97,900 | $228,500 |
| 2019 | $2,189 | $308,500 | $92,400 | $216,100 |
Source: Public Records
Map
Nearby Homes
- 181 E 9180 S
- 362 E 9150 S
- 412 E 8760 S
- 8558 S Center St
- 270 E 8680 S
- 487 E 9270 S
- 112 E 8680 S
- 37 Crawford Place
- 8732 S 620 E
- 220 E Pioneer Ave
- 194 Pioneer Ave
- 186 Brent Cir
- 149 E Pioneer Ave
- 87 W 8710 S
- 136 W Freedom Ave Unit 136
- 87 Pioneer Ave
- 8459 S 300 E
- 227 E St Germain Way
- 8797 Green Way Unit 3
- 8470 Solar Way
Your Personal Tour Guide
Ask me questions while you tour the home.