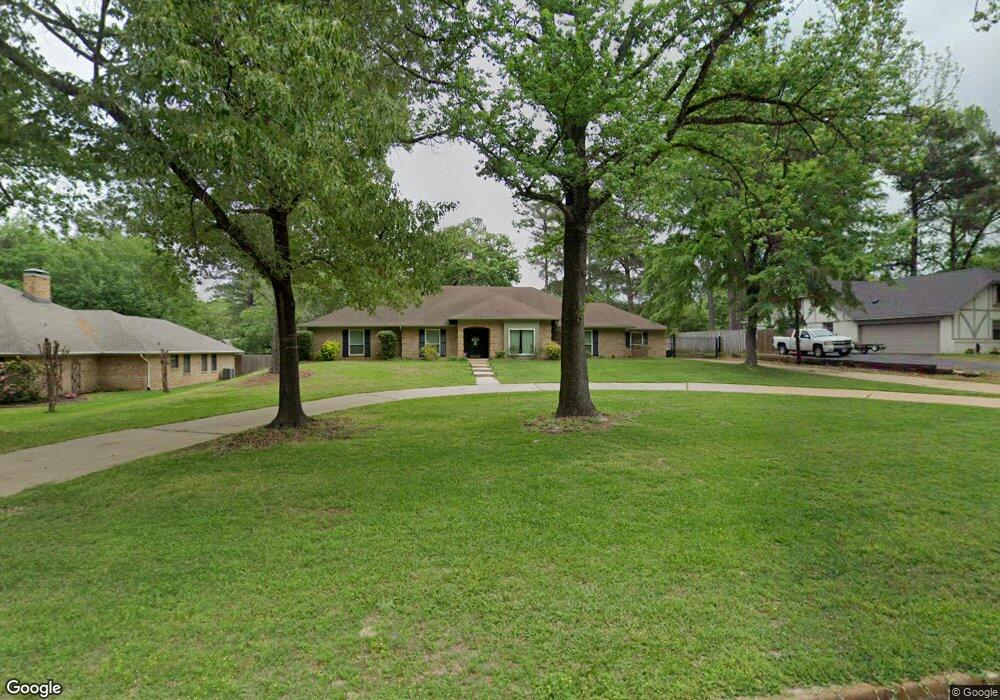
9074 Elm Tree Cir Tyler, TX 75703
The Cumberland Estates NeighborhoodEstimated Value: $510,582 - $581,000
4
Beds
3
Baths
3,230
Sq Ft
$166/Sq Ft
Est. Value
About This Home
This home is located at 9074 Elm Tree Cir, Tyler, TX 75703 and is currently estimated at $535,646, approximately $165 per square foot. 9074 Elm Tree Cir is a home located in Smith County with nearby schools including Stanton-Smith Elementary School, J.W. Holloway Sixth Grade School, and Whitehouse High School.
Ownership History
Date
Name
Owned For
Owner Type
Purchase Details
Closed on
Jul 30, 2012
Sold by
Jones Jared N and Jones Kathryn Allyson Rosa
Bought by
Johnson Powell A and Johnson Cathryn D
Current Estimated Value
Home Financials for this Owner
Home Financials are based on the most recent Mortgage that was taken out on this home.
Original Mortgage
$260,482
Outstanding Balance
$179,248
Interest Rate
3.68%
Mortgage Type
VA
Estimated Equity
$356,398
Purchase Details
Closed on
Jul 26, 2006
Sold by
Little Wilmer S and Little Patricia Dianne
Bought by
Jones Jared N
Home Financials for this Owner
Home Financials are based on the most recent Mortgage that was taken out on this home.
Original Mortgage
$226,800
Interest Rate
6.62%
Mortgage Type
New Conventional
Create a Home Valuation Report for This Property
The Home Valuation Report is an in-depth analysis detailing your home's value as well as a comparison with similar homes in the area
Home Values in the Area
Average Home Value in this Area
Purchase History
| Date | Buyer | Sale Price | Title Company |
|---|---|---|---|
| Johnson Powell A | $255,000 | Chicago Title Insurance Co | |
| Jones Jared N | -- | None Available |
Source: Public Records
Mortgage History
| Date | Status | Borrower | Loan Amount |
|---|---|---|---|
| Open | Johnson Powell A | $260,482 | |
| Previous Owner | Jones Jared N | $226,800 |
Source: Public Records
Tax History Compared to Growth
Tax History
| Year | Tax Paid | Tax Assessment Tax Assessment Total Assessment is a certain percentage of the fair market value that is determined by local assessors to be the total taxable value of land and additions on the property. | Land | Improvement |
|---|---|---|---|---|
| 2025 | $5,906 | $531,908 | $140,588 | $391,320 |
| 2024 | $5,906 | $454,420 | $91,140 | $401,330 |
| 2023 | $6,289 | $436,943 | $91,140 | $345,803 |
| 2022 | $6,551 | $375,554 | $68,355 | $307,199 |
| 2021 | $6,420 | $343,583 | $68,355 | $275,228 |
| 2020 | $6,262 | $324,464 | $65,165 | $259,299 |
| 2019 | $6,311 | $316,390 | $65,165 | $251,225 |
| 2018 | $5,743 | $289,633 | $45,570 | $244,063 |
| 2017 | $5,077 | $289,633 | $45,570 | $244,063 |
| 2016 | $5,019 | $286,311 | $45,570 | $240,741 |
| 2015 | $4,576 | $275,292 | $45,570 | $229,722 |
| 2014 | $4,576 | $276,281 | $45,570 | $230,711 |
Source: Public Records
Map
Nearby Homes
- 9211 Elm Tree Cir
- 1625 Skidmore Ln
- 1261 Luann Ln
- 1266 Santa fe Trail
- 1633 Legacy Ct
- 1211 Centennial Trail
- 8811 Wilder Trail
- 8831 Wilder Trail
- 8714 Wilder Trail
- 8702 Wilder Trail
- 8741 Wilder Trail
- 1242 Rainmaker
- 1242 Colt Ln
- 8810 Wilder Trail
- 16058 Chris Ln
- 629 Winding Brook Ln
- 3709 Paluxy Dr
- 9214 Stonebank Crossing
- 628 Wilder Way
- 533 Skipping Stone Ln
- 9062 9062 Elm Tree Cir
- 9108 Elm Tree Cir
- 9062 Elm Tree Cir
- 9108 9108 Elm Tree Cir
- 9132 Elm Tree Cir
- 9132 9132 Elm Tree Cir
- 9115 9115 Old Hickory
- 9028 Elm Tree Cir
- 9115 Old Hickory Rd
- 9065 Old Hickory Rd
- 9075 Elm Tree Cir
- 9125 Old Hickory Rd
- 9119 Elm Tree Cir
- 9146 Elm Tree Cir
- 9041 Elm Tree Cir
- 9018 Elm Tree Cir
- 9141 Elm Tree Cir
- 9141 9141 Elm Tree Cir
- 9045 9045 Old Hickory
- 9045 Old Hickory Rd