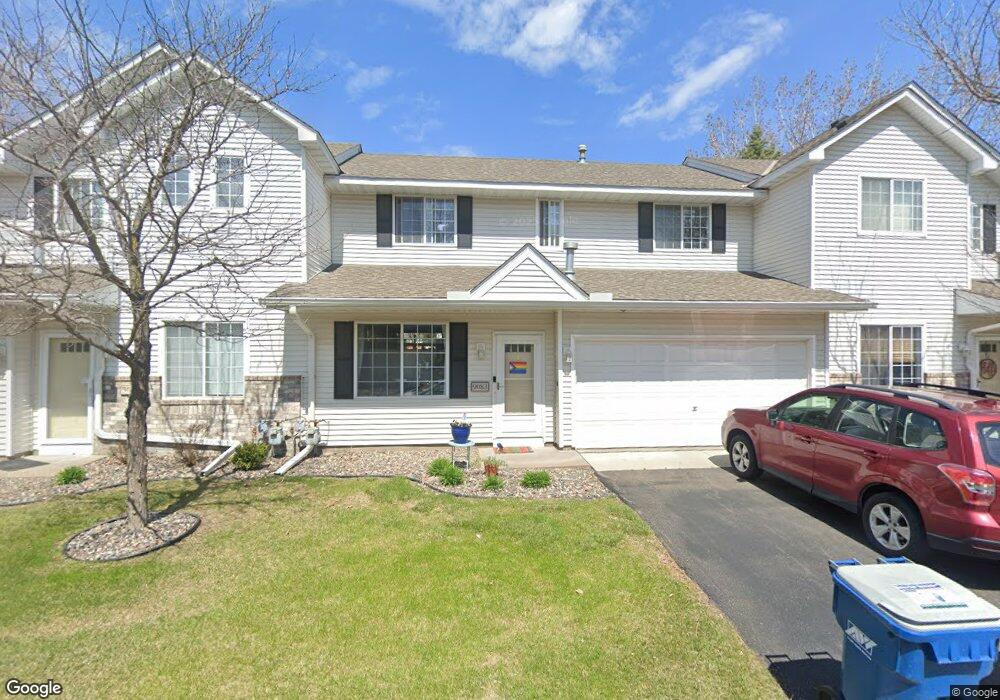
9075 9075 MerriMac-Lane-n Maple Grove, MN 55311
Estimated Value: $288,000 - $306,000
2
Beds
2
Baths
1,650
Sq Ft
$182/Sq Ft
Est. Value
About This Home
This home is located at 9075 9075 MerriMac-Lane-n, Maple Grove, MN 55311 and is currently estimated at $299,535, approximately $181 per square foot. 9075 9075 MerriMac-Lane-n is a home located in Hennepin County with nearby schools including Rush Creek Elementary School, Maple Grove Middle School, and Maple Grove Senior High School.
Ownership History
Date
Name
Owned For
Owner Type
Purchase Details
Closed on
Sep 2, 2022
Sold by
Barthel Brian and Barthel Karen
Bought by
Laqua Andrew and Eckman Corey
Current Estimated Value
Home Financials for this Owner
Home Financials are based on the most recent Mortgage that was taken out on this home.
Original Mortgage
$279,300
Outstanding Balance
$267,447
Interest Rate
5.54%
Mortgage Type
New Conventional
Estimated Equity
$32,088
Purchase Details
Closed on
Aug 22, 2022
Sold by
Barthel Brian and Barthel Karen
Bought by
Laqua Andrew and Eckman Corey
Home Financials for this Owner
Home Financials are based on the most recent Mortgage that was taken out on this home.
Original Mortgage
$279,300
Outstanding Balance
$267,447
Interest Rate
5.54%
Mortgage Type
New Conventional
Estimated Equity
$32,088
Purchase Details
Closed on
Feb 18, 2020
Sold by
Hanson Benjamin and Ceason Brittany
Bought by
Barthel Brian
Home Financials for this Owner
Home Financials are based on the most recent Mortgage that was taken out on this home.
Original Mortgage
$218,500
Interest Rate
3.6%
Mortgage Type
New Conventional
Purchase Details
Closed on
Aug 30, 2018
Sold by
Pazderka Patrick J and Pazderka Christina M
Bought by
Ceason Brittany and Ceason Benjamin
Home Financials for this Owner
Home Financials are based on the most recent Mortgage that was taken out on this home.
Original Mortgage
$216,125
Interest Rate
4.5%
Mortgage Type
New Conventional
Purchase Details
Closed on
Jul 17, 2012
Sold by
Pazderka Christina M and Pazderka Patrick J
Bought by
Pazderka Patrick J and Pazderka Christina M
Purchase Details
Closed on
Oct 17, 2008
Sold by
Sukhumaran Balaji
Bought by
Bruhn Christina M
Purchase Details
Closed on
Oct 22, 2004
Sold by
Engel James J
Bought by
Sukhumaran Balaji and Jayachandran Vijayalaksmi
Purchase Details
Closed on
Jul 30, 2003
Sold by
Breitbach Kari A
Bought by
Engel James J
Purchase Details
Closed on
May 15, 2000
Sold by
Thoms Paul R
Bought by
Breitbach Dean J and Leukam Breitbach Kari A
Purchase Details
Closed on
Feb 25, 1998
Sold by
Centex Homes Minnesota Division
Bought by
Thoms Paul R and Thoms Nicole L
Create a Home Valuation Report for This Property
The Home Valuation Report is an in-depth analysis detailing your home's value as well as a comparison with similar homes in the area
Home Values in the Area
Average Home Value in this Area
Purchase History
| Date | Buyer | Sale Price | Title Company |
|---|---|---|---|
| Laqua Andrew | $294,000 | -- | |
| Laqua Andrew | $294,000 | None Listed On Document | |
| Barthel Brian | $230,000 | Network Title Inc | |
| Ceason Brittany | $227,500 | Global Closing & Title Servi | |
| Pazderka Patrick J | -- | Title Source Inc | |
| Bruhn Christina M | $187,000 | -- | |
| Sukhumaran Balaji | $196,400 | -- | |
| Engel James J | $205,000 | -- | |
| Breitbach Dean J | $159,900 | -- | |
| Thoms Paul R | $136,895 | -- |
Source: Public Records
Mortgage History
| Date | Status | Borrower | Loan Amount |
|---|---|---|---|
| Open | Laqua Andrew | $279,300 | |
| Closed | Laqua Andrew | $279,300 | |
| Previous Owner | Barthel Brian | $218,500 | |
| Previous Owner | Ceason Brittany | $216,125 |
Source: Public Records
Tax History Compared to Growth
Tax History
| Year | Tax Paid | Tax Assessment Tax Assessment Total Assessment is a certain percentage of the fair market value that is determined by local assessors to be the total taxable value of land and additions on the property. | Land | Improvement |
|---|---|---|---|---|
| 2024 | $3,764 | $295,600 | $81,200 | $214,400 |
| 2023 | $3,580 | $283,500 | $70,600 | $212,900 |
| 2022 | $2,819 | $280,500 | $52,000 | $228,500 |
| 2021 | $2,673 | $244,800 | $44,200 | $200,600 |
| 2020 | $2,693 | $230,000 | $36,200 | $193,800 |
| 2019 | $2,907 | $221,100 | $41,100 | $180,000 |
| 2018 | $2,884 | $211,100 | $44,500 | $166,600 |
| 2017 | $2,641 | $180,300 | $38,000 | $142,300 |
| 2016 | $2,811 | $189,200 | $54,000 | $135,200 |
| 2015 | $2,775 | $181,700 | $57,000 | $124,700 |
| 2014 | -- | $148,100 | $37,000 | $111,100 |
Source: Public Records
Map
Nearby Homes
- 9125 Olive Ln N
- 17475 90th Ave N
- 18053 90th Place N
- 9260 Merrimac Ln N
- 10145 Peony Ln N
- 10154 Peony Ln N
- 18244 88th Place N
- 9245 Holly Ln N Unit 704
- 17198 93rd Place N Unit 62
- 9440 Jewel Ln N
- 9433 Jewel Ln N
- 8688 Vagabond Ln N
- 9477 Jewel Ln N
- 17913 96th Ave N
- 17868 96th Ave N
- 16955 Weaver Lake Dr
- 9150 Comstock Ln N
- 9365 Tewsbury Bend
- 8858 Comstock Ct
- 9138 Comstock Ln N Unit 204
- 9091 Merrimac Ln N Unit 505
- 9083 Merrimac Ln N
- 9075 Merrimac Ln N
- 9087 9087 Merrimac-lane-n
- 9091 9091 Merrimac Ln N
- 9087 Merrimac Ln N Unit 504
- 9079 Merrimac Ln N Unit 502
- 9077 Merrimac Ln N
- 9081 Merrimac Ln N Unit 604
- 9093 Merrimac Ln N
- 9085 Merrimac Ln N Unit 603
- 9089 Merrimac Ln N
- 9093 9093 Merrimac Ln N
- 9077 9077 Merrimac Ln N
- 17663 91st Ave N
- 17675 91st Ave N
- 17651 91st Ave N
- 17697 91st Ave N
- 9092 Merrimac Ln N
- 9080 Merrimac Ln N