908 11 1/2 St SW Rochester, MN 55902
Parkway NeighborhoodEstimated Value: $304,000 - $388,000
3
Beds
2
Baths
1,402
Sq Ft
$244/Sq Ft
Est. Value
About This Home
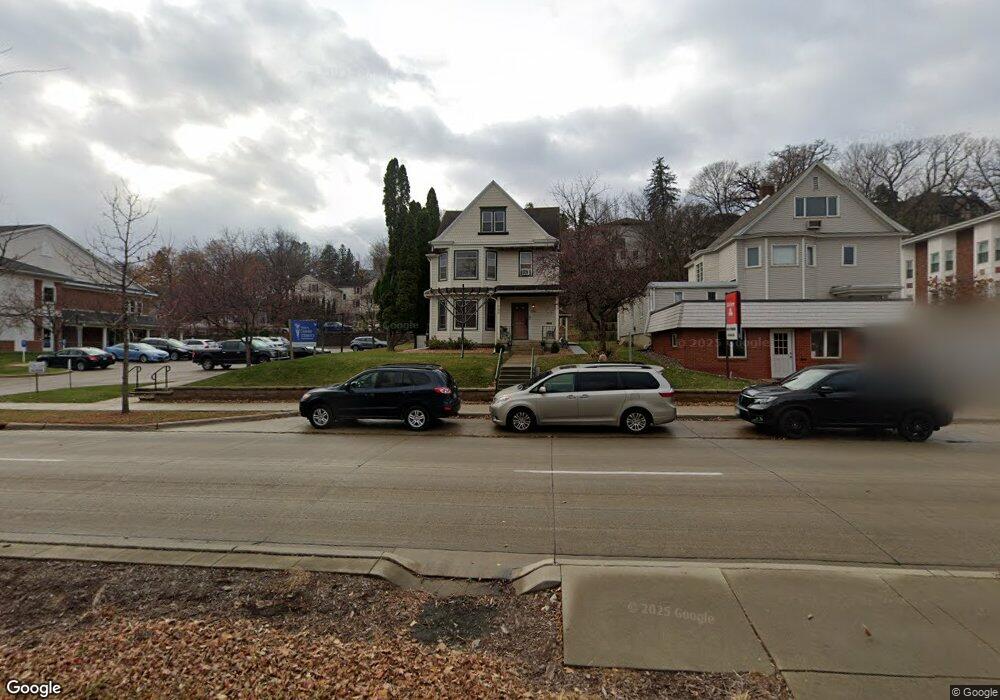
This home is located at 908 11 1/2 St SW, Rochester, MN 55902 and is currently estimated at $342,789, approximately $244 per square foot. 908 11 1/2 St SW is a home located in Olmsted County with nearby schools including Folwell Elementary School, John Adams Middle School, and Mayo Senior High School.
Ownership History
Date
Name
Owned For
Owner Type
Purchase Details
Closed on
Jan 16, 2007
Sold by
Schreiber Sarah and Schreiber Todd R
Bought by
Shreiber Sarah K and Conti Sarah K
Current Estimated Value
Home Financials for this Owner
Home Financials are based on the most recent Mortgage that was taken out on this home.
Original Mortgage
$120,000
Interest Rate
6.36%
Mortgage Type
New Conventional
Purchase Details
Closed on
Nov 30, 2006
Sold by
Schreiber Sarah K and Schreiber Todd R
Bought by
Schreiber Sarah K and Schreiber Todd R
Home Financials for this Owner
Home Financials are based on the most recent Mortgage that was taken out on this home.
Original Mortgage
$120,000
Interest Rate
6.36%
Mortgage Type
New Conventional
Purchase Details
Closed on
May 10, 2006
Sold by
Kielezewski Sarah and Conti Joseph John
Bought by
Conti Sarah Kielczewski and Conti Joseph John
Create a Home Valuation Report for This Property
The Home Valuation Report is an in-depth analysis detailing your home's value as well as a comparison with similar homes in the area
Home Values in the Area
Average Home Value in this Area
Purchase History
| Date | Buyer | Sale Price | Title Company |
|---|---|---|---|
| Shreiber Sarah K | -- | Title Services Inc | |
| Schreiber Sarah K | -- | Title Services Inc | |
| Conti Sarah Kielczewski | -- | Title Services Inc | |
| Conti Sarah Kielczewski | -- | None Available |
Source: Public Records
Mortgage History
| Date | Status | Borrower | Loan Amount |
|---|---|---|---|
| Closed | Schreiber Sarah K | $120,000 |
Source: Public Records
Tax History Compared to Growth
Tax History
| Year | Tax Paid | Tax Assessment Tax Assessment Total Assessment is a certain percentage of the fair market value that is determined by local assessors to be the total taxable value of land and additions on the property. | Land | Improvement |
|---|---|---|---|---|
| 2024 | $4,248 | $299,300 | $100,000 | $199,300 |
| 2023 | $3,350 | $276,700 | $60,000 | $216,700 |
| 2022 | $2,936 | $244,500 | $60,000 | $184,500 |
| 2021 | $2,796 | $229,600 | $60,000 | $169,600 |
| 2020 | $2,734 | $218,000 | $60,000 | $158,000 |
| 2019 | $2,596 | $206,400 | $60,000 | $146,400 |
| 2018 | $2,080 | $198,100 | $60,000 | $138,100 |
| 2017 | $2,080 | $185,500 | $50,000 | $135,500 |
| 2016 | $1,950 | $138,900 | $25,800 | $113,100 |
| 2015 | $1,768 | $127,300 | $25,300 | $102,000 |
| 2014 | $1,766 | $123,500 | $25,100 | $98,400 |
| 2012 | -- | $125,900 | $25,230 | $100,670 |
Source: Public Records
Map
Nearby Homes
- 848 8th Ave SW
- 836 8th Ave SW
- 1103 Skyline Dr SW
- 2485 14th Ave SW
- 2482 14th Ave SW
- 2420 14th Ave SW
- 2458 14th Ave SW
- 2427 14th Ave SW
- 2469 14th Ave SW
- 2419 14th Ave SW
- 2466 14th Ave SW
- 2411 14th Ave SW
- 2477 14th Ave SW
- 2453 14th Ave SW
- 2461 14th Ave SW
- 2450 14th Ave SW
- 2435 14th Ave SW
- 2474 14th Ave SW
- 1239 3rd Ave SW
- 1503 6th Ave SW
- 912 11 1/2 St SW
- 1101 Memorial Pkwy SW
- 918 11 1/2 St SW
- 924 11 1/2 St SW
- 925 Memorial Pkwy SW
- 909 11 1/2 St SW
- 909 909 11-1 2-Street-sw
- 915 11 1/2 St SW
- 921 11 1/2 St SW
- 930 11 1/2 St SW
- 1102 Memorial Pkwy SW
- 927 11 1/2 St SW
- 927 11 1 2 St SW
- 919 Memorial Pkwy SW
- 936 11 1/2 St SW
- 910 Memorial Pkwy SW
- 868 11 1/2 St SW
- 935 11 1/2 St SW
- 920 11 1/4 St SW
- 915 Memorial Pkwy SW