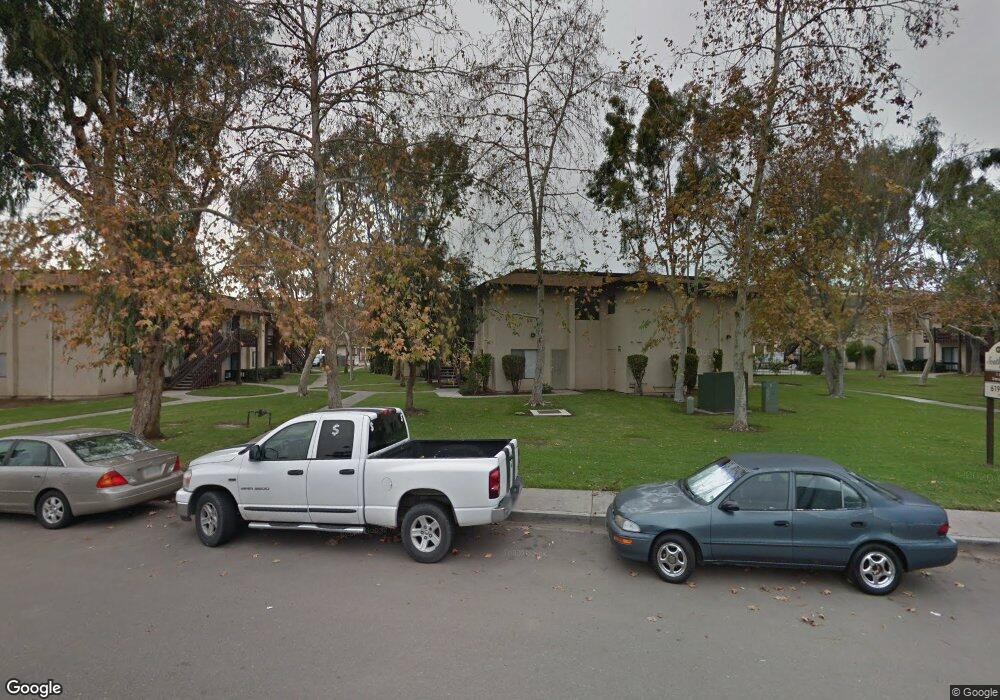
908 Beyer Way Unit 12 San Diego, CA 92154
Otay Mesa West NeighborhoodEstimated Value: $277,505 - $573,000
1
Bed
1
Bath
592
Sq Ft
$696/Sq Ft
Est. Value
About This Home
This home is located at 908 Beyer Way Unit 12, San Diego, CA 92154 and is currently estimated at $412,126, approximately $696 per square foot. 908 Beyer Way Unit 12 is a home located in San Diego County with nearby schools including Howard Pence Elementary School, Montgomery Middle School, and Montgomery Senior High School.
Ownership History
Date
Name
Owned For
Owner Type
Purchase Details
Closed on
Aug 20, 2014
Sold by
Southgate Village Estates Llc
Bought by
Southgate Village Estate Llc
Current Estimated Value
Purchase Details
Closed on
Dec 12, 2001
Sold by
Bwy Ralph and Bwy Chris
Bought by
Bwy Ralph
Home Financials for this Owner
Home Financials are based on the most recent Mortgage that was taken out on this home.
Original Mortgage
$8,700,000
Interest Rate
6.57%
Mortgage Type
Balloon
Purchase Details
Closed on
Nov 28, 2001
Sold by
Web Service Company Inc
Bought by
Bwy Ralph
Home Financials for this Owner
Home Financials are based on the most recent Mortgage that was taken out on this home.
Original Mortgage
$8,700,000
Interest Rate
6.57%
Mortgage Type
Balloon
Create a Home Valuation Report for This Property
The Home Valuation Report is an in-depth analysis detailing your home's value as well as a comparison with similar homes in the area
Home Values in the Area
Average Home Value in this Area
Purchase History
| Date | Buyer | Sale Price | Title Company |
|---|---|---|---|
| Southgate Village Estate Llc | -- | Stewart Title Of Ca Inc | |
| Bwy Ralph | -- | Commonwealth Land Title Co | |
| Bwy Ralph | -- | Commonwealth Land Title Co | |
| Bwy Ralph | -- | Commonwealth Land Title Co |
Source: Public Records
Mortgage History
| Date | Status | Borrower | Loan Amount |
|---|---|---|---|
| Previous Owner | Bwy Ralph | $8,700,000 |
Source: Public Records
Tax History Compared to Growth
Tax History
| Year | Tax Paid | Tax Assessment Tax Assessment Total Assessment is a certain percentage of the fair market value that is determined by local assessors to be the total taxable value of land and additions on the property. | Land | Improvement |
|---|---|---|---|---|
| 2025 | $635 | $52,939 | $5,323 | $47,616 |
| 2024 | $635 | $51,902 | $5,219 | $46,683 |
| 2023 | $630 | $50,885 | $5,117 | $45,768 |
| 2022 | $618 | $49,888 | $5,017 | $44,871 |
| 2021 | $600 | $48,911 | $4,919 | $43,992 |
| 2020 | $586 | $48,410 | $4,869 | $43,541 |
| 2019 | $586 | $47,462 | $4,774 | $42,688 |
| 2018 | $576 | $46,532 | $4,681 | $41,851 |
| 2017 | $565 | $45,621 | $4,590 | $41,031 |
| 2016 | $545 | $44,727 | $4,500 | $40,227 |
| 2015 | $544 | $44,056 | $4,433 | $39,623 |
| 2014 | $536 | $43,194 | $4,347 | $38,847 |
Source: Public Records
Map
Nearby Homes
- 856 Orchid Way
- 750 Hawaii Ave
- 1029 Reef Dr
- 3470 Robb Roy Place
- 3443 Alonquin Way
- 3124 Caminito Quixote
- 3206 Caminito Quixote
- 1011 Beyer Way Unit 32
- 3340 Del Sol Blvd Unit SPC 216
- 3340 Del Sol Blvd Unit 215
- 3340 Del Sol Blvd Unit 208
- 3340 Del Sol Blvd Unit 139
- 3340 Del Sol Blvd Unit 268
- 3340 Del Sol Blvd Unit 144
- 3340 Del Sol Blvd Unit SPC 126
- 3340 Del Sol Blvd Unit 125
- 3340 Del Sol Blvd Unit 111
- 3340 Del Sol Blvd Unit 198
- 3340 Del Sol Blvd Unit 227
- 3340 Del Sol Blvd Unit 117
- 898 Beyer Way Unit 2
- 898 Beyer Way Unit 1
- 908 Beyer Way Unit 14
- 908 Beyer Way Unit 13
- 908 Beyer Way Unit 11
- 908 Beyer Way Unit 10
- 908 Beyer Way Unit 9
- 908 Beyer Way Unit 8
- 908 Beyer Way Unit 7
- 908 Beyer Way Unit 6
- 908 Beyer Way Unit 5
- 908 Beyer Way Unit 4
- 908 Beyer Way Unit 3
- 908 Beyer Way Unit 2
- 908 Beyer Way Unit 1
- 940 Beyer Way Unit 16
- 940 Beyer Way Unit 15
- 940 Beyer Way Unit 14
- 940 Beyer Way Unit 13
- 940 Beyer Way Unit 12