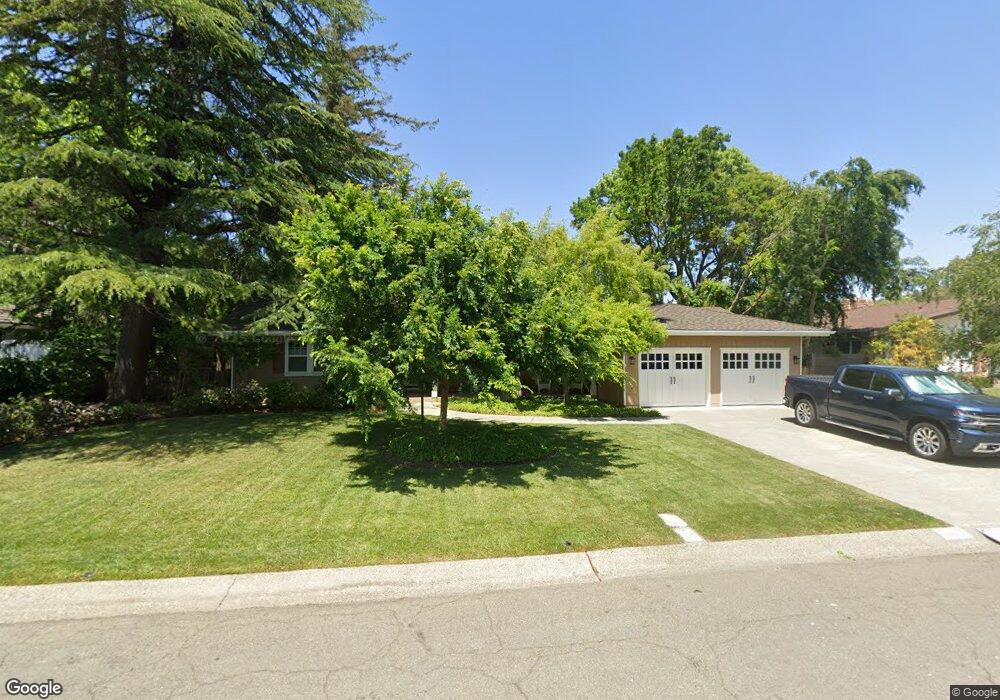
908 Calle Del Caballo St Fairfield, CA 94534
Estimated Value: $911,375 - $1,205,000
3
Beds
3
Baths
2,172
Sq Ft
$467/Sq Ft
Est. Value
About This Home
This home is located at 908 Calle Del Caballo St, Fairfield, CA 94534 and is currently estimated at $1,015,344, approximately $467 per square foot. 908 Calle Del Caballo St is a home located in Solano County with nearby schools including Nelda Mundy Elementary School, Green Valley Middle School, and Angelo Rodriguez High School.
Ownership History
Date
Name
Owned For
Owner Type
Purchase Details
Closed on
Feb 18, 2025
Sold by
Maher Clorinda L
Bought by
Clorinda L Maher Revocable Living Trust and Maher
Current Estimated Value
Purchase Details
Closed on
Nov 7, 2024
Sold by
Maher Clorinda L and Maher Steven M
Bought by
Maher Clorinda L
Purchase Details
Closed on
Nov 10, 2003
Sold by
Maher Steven M and Maher Steven
Bought by
Maher Steven M and Maher Clorinda L
Home Financials for this Owner
Home Financials are based on the most recent Mortgage that was taken out on this home.
Original Mortgage
$365,000
Interest Rate
4.12%
Mortgage Type
Purchase Money Mortgage
Purchase Details
Closed on
Nov 17, 1993
Sold by
Robertson Valentine M
Bought by
Robertson Willis
Create a Home Valuation Report for This Property
The Home Valuation Report is an in-depth analysis detailing your home's value as well as a comparison with similar homes in the area
Home Values in the Area
Average Home Value in this Area
Purchase History
| Date | Buyer | Sale Price | Title Company |
|---|---|---|---|
| Clorinda L Maher Revocable Living Trust | -- | None Listed On Document | |
| Maher Clorinda L | -- | None Listed On Document | |
| Maher Steven M | -- | First American Title Co | |
| Robertson Willis | -- | North American Title Co Inc |
Source: Public Records
Mortgage History
| Date | Status | Borrower | Loan Amount |
|---|---|---|---|
| Previous Owner | Maher Steven M | $365,000 |
Source: Public Records
Tax History Compared to Growth
Tax History
| Year | Tax Paid | Tax Assessment Tax Assessment Total Assessment is a certain percentage of the fair market value that is determined by local assessors to be the total taxable value of land and additions on the property. | Land | Improvement |
|---|---|---|---|---|
| 2025 | $6,562 | $545,183 | $183,975 | $361,208 |
| 2024 | $6,562 | $534,494 | $180,368 | $354,126 |
| 2023 | $6,374 | $524,015 | $176,832 | $347,183 |
| 2022 | $6,292 | $513,741 | $173,366 | $340,375 |
| 2021 | $6,224 | $503,668 | $169,967 | $333,701 |
| 2020 | $6,081 | $498,505 | $168,225 | $330,280 |
| 2019 | $5,929 | $488,731 | $164,927 | $323,804 |
| 2018 | $6,087 | $479,149 | $161,694 | $317,455 |
| 2017 | $5,818 | $469,755 | $158,524 | $311,231 |
| 2016 | $5,772 | $460,545 | $155,416 | $305,129 |
| 2015 | $5,410 | $453,628 | $153,082 | $300,546 |
| 2014 | $5,355 | $444,743 | $150,084 | $294,659 |
Source: Public Records
Map
Nearby Homes
- 1687 Rockville Rd
- 4320 Edinburg Ct
- 0 Vac Sn Luis Potosi Vic Eljorna Unit HD25051665
- 103 Brae Ct
- 4418 Green Valley Rd
- 1795 Green Valley Oaks Dr
- 4499 Green Valley Rd
- 1879 Rockville Rd
- 4144 Green Valley Rd
- 1424 Rockville Rd
- 1009 Cypressridge Place
- 0 Green Valley Ln Unit Lot 5 325038523
- 0 Green Valley Ln Unit Lot 6 325038375
- 0 Green Valley Ln Unit Lot 3 325038524
- 955 Appleridge Place
- 5249 Deer Ridge Ct
- 743 Bridle Ridge Ct
- 746 Bridle Ridge Ct
- 744 Emerald Bay Dr
- 738 Bridle Ridge Ct
- 910 Calle Del Caballo St
- 909 Calle Del Caballo St
- 912 Calle Del Caballo St
- 907 Calle Del Caballo St
- 911 Calle Del Caballo St
- 905 Calle Del Caballo St
- 914 Calle Del Caballo St
- 902 Calle Del Caballo St
- 404 Via Vaquero
- 404 Via Vaquero Unkn
- 903 Calle Del Caballo St
- 401 Paseo Arboles
- 403 Via Vaquero
- 403 Via Vaquero Unkn
- 101 Cerrada Azul
- 902 Via Pajaro
- 403 Paseo Arboles
- 403 Paseo Arboles Unkn
- 902 Via Pajaro Unkn
- 904 Via Pajaro