Estimated Value: $135,000 - $194,000
3
Beds
2
Baths
1,454
Sq Ft
$108/Sq Ft
Est. Value
About This Home
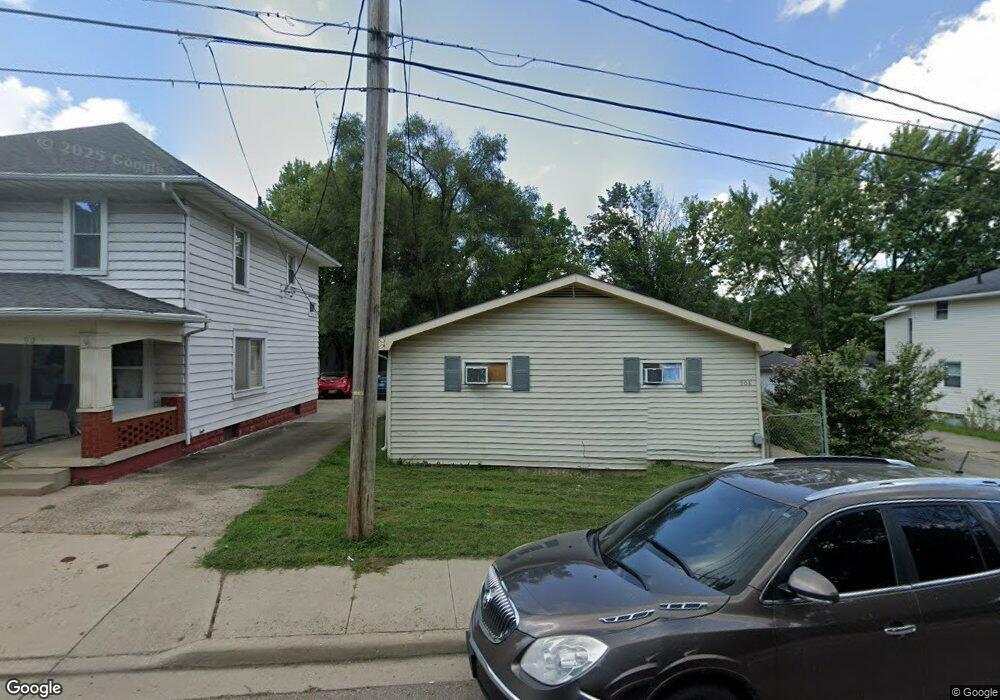
This home is located at 908 Covington Ave, Piqua, OH 45356 and is currently estimated at $157,080, approximately $108 per square foot. 908 Covington Ave is a home located in Miami County with nearby schools including Piqua Junior High School, Piqua High School, and Nicholas School.
Ownership History
Date
Name
Owned For
Owner Type
Purchase Details
Closed on
Oct 20, 2016
Sold by
Federal Home Loan Mortgage Corporation
Bought by
Chappies Investments Llc
Current Estimated Value
Purchase Details
Closed on
Feb 29, 2016
Sold by
Unity National Bank
Bought by
Federal Home Loan Mortgage Corporation
Purchase Details
Closed on
Feb 19, 2016
Sold by
Mears Donald Allan
Bought by
Unity National Bank
Purchase Details
Closed on
Jan 29, 2016
Sold by
Mears Donald Allan
Bought by
Unity National Bamk
Purchase Details
Closed on
Feb 17, 2012
Sold by
Mears Dennis N
Bought by
Mears Donald Allan
Purchase Details
Closed on
Aug 8, 2011
Sold by
Mears Dennis N
Bought by
Mears Donald Allan
Purchase Details
Closed on
Feb 17, 2010
Sold by
Mears Donald Allan
Bought by
Mears Dennis N
Purchase Details
Closed on
Aug 16, 2007
Sold by
Mears Dennis N
Bought by
Mears Donald Allan
Purchase Details
Closed on
Jun 1, 1995
Sold by
Crouch Harvey R
Bought by
Mears Dennis N
Create a Home Valuation Report for This Property
The Home Valuation Report is an in-depth analysis detailing your home's value as well as a comparison with similar homes in the area
Home Values in the Area
Average Home Value in this Area
Purchase History
| Date | Buyer | Sale Price | Title Company |
|---|---|---|---|
| Chappies Investments Llc | -- | None Available | |
| Federal Home Loan Mortgage Corporation | -- | Attorney | |
| Unity National Bank | $42,000 | Attorney | |
| Unity National Bamk | $42,000 | Attorney | |
| Mears Donald Allan | -- | -- | |
| Mears Donald Allan | -- | -- | |
| Mears Dennis N | -- | -- | |
| Mears Donald Allan | -- | -- | |
| Mears Dennis N | $62,000 | -- |
Source: Public Records
Mortgage History
| Date | Status | Borrower | Loan Amount |
|---|---|---|---|
| Closed | Mears Dennis N | -- |
Source: Public Records
Tax History
| Year | Tax Paid | Tax Assessment Tax Assessment Total Assessment is a certain percentage of the fair market value that is determined by local assessors to be the total taxable value of land and additions on the property. | Land | Improvement |
|---|---|---|---|---|
| 2025 | $1,688 | $46,590 | $5,290 | $41,300 |
| 2024 | $1,688 | $27,410 | $5,950 | $21,460 |
| 2023 | $1,156 | $27,410 | $5,950 | $21,460 |
| 2022 | $1,176 | $27,410 | $5,950 | $21,460 |
| 2021 | $949 | $20,300 | $4,410 | $15,890 |
| 2020 | $933 | $20,300 | $4,410 | $15,890 |
| 2019 | $938 | $20,300 | $4,410 | $15,890 |
| 2018 | $984 | $20,300 | $4,410 | $15,890 |
| 2017 | $1,273 | $25,940 | $4,410 | $21,530 |
| 2016 | $1,365 | $25,940 | $4,410 | $21,530 |
| 2015 | $1,205 | $24,930 | $4,240 | $20,690 |
| 2014 | $1,205 | $24,930 | $4,240 | $20,690 |
| 2013 | $1,209 | $24,930 | $4,240 | $20,690 |
Source: Public Records
Map
Nearby Homes
- 912 Covington Ave
- 904 Covington Ave
- 0 Covington Ave
- 914 Covington Ave
- 902 Covington Ave
- 916 Covington Ave
- 918 Covington Ave
- 920 Covington Ave
- 922 Covington Ave
- 915 Covington Ave
- 905 Covington Ave
- 913 Covington Ave Unit 3
- 913 Covington Ave Unit 2
- 913 Covington Ave
- 917 Covington Ave
- 926 Covington Ave
- 829 Covington Ave
- 919 Covington Ave
- 921 Covington Ave
- 826 Covington Ave
Your Personal Tour Guide
Ask me questions while you tour the home.