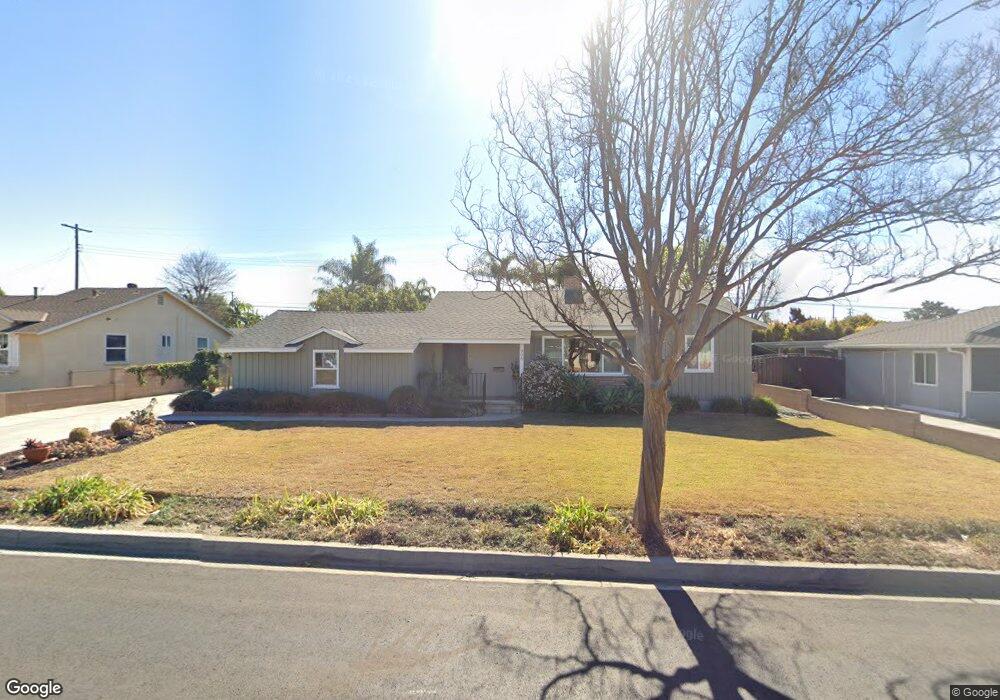
908 E Lucille Ave West Covina, CA 91790
Estimated Value: $848,906 - $978,000
3
Beds
2
Baths
1,793
Sq Ft
$509/Sq Ft
Est. Value
About This Home
This home is located at 908 E Lucille Ave, West Covina, CA 91790 and is currently estimated at $912,477, approximately $508 per square foot. 908 E Lucille Ave is a home located in Los Angeles County with nearby schools including Merlinda Elementary School, Walnut Grove Intermediate School, and West Covina High School.
Ownership History
Date
Name
Owned For
Owner Type
Purchase Details
Closed on
Jul 26, 2011
Sold by
Garcia Raul J and Garcia Carmen T
Bought by
Garcia Raul Jose and Garcia Carmen T
Current Estimated Value
Purchase Details
Closed on
Apr 13, 2009
Sold by
Garcia Raul J and Garcia Carmen T
Bought by
Garcia Raul J
Home Financials for this Owner
Home Financials are based on the most recent Mortgage that was taken out on this home.
Original Mortgage
$260,000
Outstanding Balance
$68,180
Interest Rate
5.17%
Mortgage Type
New Conventional
Estimated Equity
$844,297
Purchase Details
Closed on
May 14, 2001
Sold by
Torres Esteban Edward and Torres Arcelia S
Bought by
Garcia Raul J
Purchase Details
Closed on
Feb 3, 1994
Sold by
Torres Esteban Edward and Torres Arcelia S
Bought by
Torres Esteban Edward
Home Financials for this Owner
Home Financials are based on the most recent Mortgage that was taken out on this home.
Original Mortgage
$141,600
Interest Rate
7.24%
Create a Home Valuation Report for This Property
The Home Valuation Report is an in-depth analysis detailing your home's value as well as a comparison with similar homes in the area
Home Values in the Area
Average Home Value in this Area
Purchase History
| Date | Buyer | Sale Price | Title Company |
|---|---|---|---|
| Garcia Raul Jose | -- | None Available | |
| Garcia Raul J | -- | Lawyers Title | |
| Garcia Raul J | -- | Benefit Land Title Company | |
| Torres Esteban Edward | -- | Gateway Title Company |
Source: Public Records
Mortgage History
| Date | Status | Borrower | Loan Amount |
|---|---|---|---|
| Open | Garcia Raul J | $260,000 | |
| Previous Owner | Torres Esteban Edward | $141,600 |
Source: Public Records
Tax History Compared to Growth
Tax History
| Year | Tax Paid | Tax Assessment Tax Assessment Total Assessment is a certain percentage of the fair market value that is determined by local assessors to be the total taxable value of land and additions on the property. | Land | Improvement |
|---|---|---|---|---|
| 2025 | $2,917 | $211,817 | $81,212 | $130,605 |
| 2024 | $2,917 | $207,665 | $79,620 | $128,045 |
| 2023 | $2,783 | $203,594 | $78,059 | $125,535 |
| 2022 | $2,798 | $199,603 | $76,529 | $123,074 |
| 2021 | $2,716 | $195,690 | $75,029 | $120,661 |
| 2019 | $2,640 | $189,887 | $72,804 | $117,083 |
| 2018 | $2,485 | $186,165 | $71,377 | $114,788 |
| 2016 | $2,257 | $178,938 | $68,606 | $110,332 |
| 2015 | $2,219 | $176,251 | $67,576 | $108,675 |
| 2014 | $2,211 | $172,800 | $66,253 | $106,547 |
Source: Public Records
Map
Nearby Homes
- 16422 Francisquito Ave
- 1850 Neff Ave
- 16645 Holton St
- 16317 Benwick St
- 944 S Sharonlee Dr
- 944 S Russelee Dr
- 920 E Herring Ave
- 1220 Wescove Place
- 1038 E Herring Ave
- 16108 Maplegrove St
- 1704 Pass And Covina Rd
- 1257 N Harvest Walk Dr Unit 42
- 731 S Valinda Ave
- 17040 E Holton St
- 905 W Sago Palm St
- 0 E Harvest Moon St
- 1020 Harrington Way
- 1027 E Vaught Ct
- 15874 Meadowside St
- 1840 S Summerplace Dr Unit 47
- 916 E Lucille Ave
- 904 E Lucille Ave
- 909 E Florence Ave
- 905 E Florence Ave
- 915 E Florence Ave
- 915 E Florence Ave
- 924 E Lucille Ave
- 844 E Lucille Ave
- 905 E Lucille Ave
- 911 E Lucille Ave
- 845 E Florence Ave
- 925 E Florence Ave
- 901 E Lucille Ave
- 917 E Lucille Ave
- 843 E Lucille Ave
- 840 E Lucille Ave
- 841 E Florence Ave
- 908 E Florence Ave
- 912 E Florence Ave
- 904 E Florence Ave