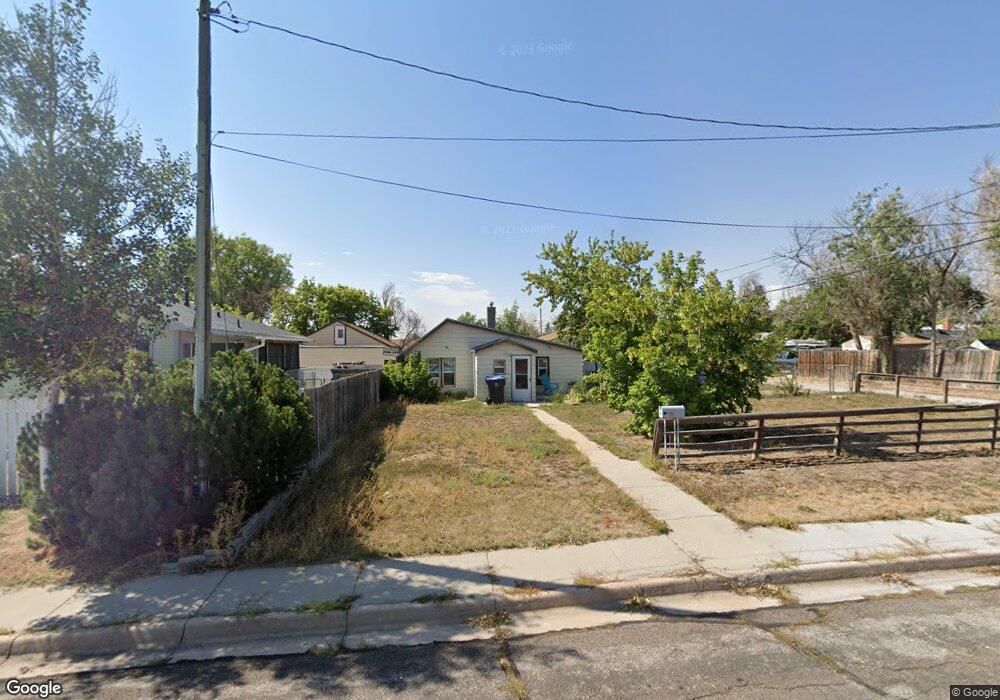
908 Fremont Ave Cheyenne, WY 82001
Estimated Value: $170,000 - $180,000
1
Bed
1
Bath
504
Sq Ft
$349/Sq Ft
Est. Value
About This Home
This home is located at 908 Fremont Ave, Cheyenne, WY 82001 and is currently estimated at $175,749, approximately $348 per square foot. 908 Fremont Ave is a home located in Laramie County with nearby schools including Lebhart Elementary School, Fairview Elementary School, and Johnson Junior High School.
Ownership History
Date
Name
Owned For
Owner Type
Purchase Details
Closed on
Jun 17, 2011
Sold by
Parsons Scott C and Curry Tara L
Bought by
Curry Tara L
Current Estimated Value
Home Financials for this Owner
Home Financials are based on the most recent Mortgage that was taken out on this home.
Original Mortgage
$52,500
Outstanding Balance
$20,345
Interest Rate
4.66%
Mortgage Type
New Conventional
Estimated Equity
$155,404
Purchase Details
Closed on
Oct 24, 2008
Sold by
Miller Adam
Bought by
Parsons Scott C and Curry Tara L
Home Financials for this Owner
Home Financials are based on the most recent Mortgage that was taken out on this home.
Original Mortgage
$31,025
Interest Rate
6%
Mortgage Type
Purchase Money Mortgage
Purchase Details
Closed on
Feb 15, 2007
Sold by
Davis Meade
Bought by
Miller Adam
Create a Home Valuation Report for This Property
The Home Valuation Report is an in-depth analysis detailing your home's value as well as a comparison with similar homes in the area
Home Values in the Area
Average Home Value in this Area
Purchase History
| Date | Buyer | Sale Price | Title Company |
|---|---|---|---|
| Curry Tara L | -- | St | |
| Parsons Scott C | -- | None Available | |
| Miller Adam | -- | None Available |
Source: Public Records
Mortgage History
| Date | Status | Borrower | Loan Amount |
|---|---|---|---|
| Open | Curry Tara L | $52,500 | |
| Closed | Parsons Scott C | $31,025 |
Source: Public Records
Tax History Compared to Growth
Tax History
| Year | Tax Paid | Tax Assessment Tax Assessment Total Assessment is a certain percentage of the fair market value that is determined by local assessors to be the total taxable value of land and additions on the property. | Land | Improvement |
|---|---|---|---|---|
| 2025 | $664 | $7,201 | $3,177 | $4,024 |
| 2024 | $664 | $9,392 | $4,235 | $5,157 |
| 2023 | $650 | $9,194 | $4,235 | $4,959 |
| 2022 | $625 | $8,652 | $4,235 | $4,417 |
| 2021 | $577 | $7,980 | $4,235 | $3,745 |
| 2020 | $557 | $7,720 | $4,235 | $3,485 |
| 2019 | $528 | $7,318 | $4,235 | $3,083 |
| 2018 | $475 | $6,644 | $3,673 | $2,971 |
| 2017 | $417 | $5,779 | $2,628 | $3,151 |
| 2016 | $363 | $5,024 | $2,481 | $2,543 |
| 2015 | $350 | $4,839 | $2,481 | $2,358 |
| 2014 | $352 | $4,839 | $2,481 | $2,358 |
Source: Public Records
Map
Nearby Homes
- 2521 E 12th St
- 2119 E 11th St
- 2709 E 9th St
- 2804 E 10th St
- 3849 E Lincolnway
- 2012 E 12th St
- 2908 E 8th St
- 1410 Carbon Ave Unit A-D
- 2314 E 15th St
- 2407 E 16th St
- 1518 Hot Springs Ave
- 2015 E 15th St
- 1602 Crook Ave
- 1502 Willow Dr
- 2110 E 16th St
- 1212 E 7th St
- 1100 Rosebud Rd
- 2123 E 18th St
- 1551 Oak Ct
- 1911 E 17th St