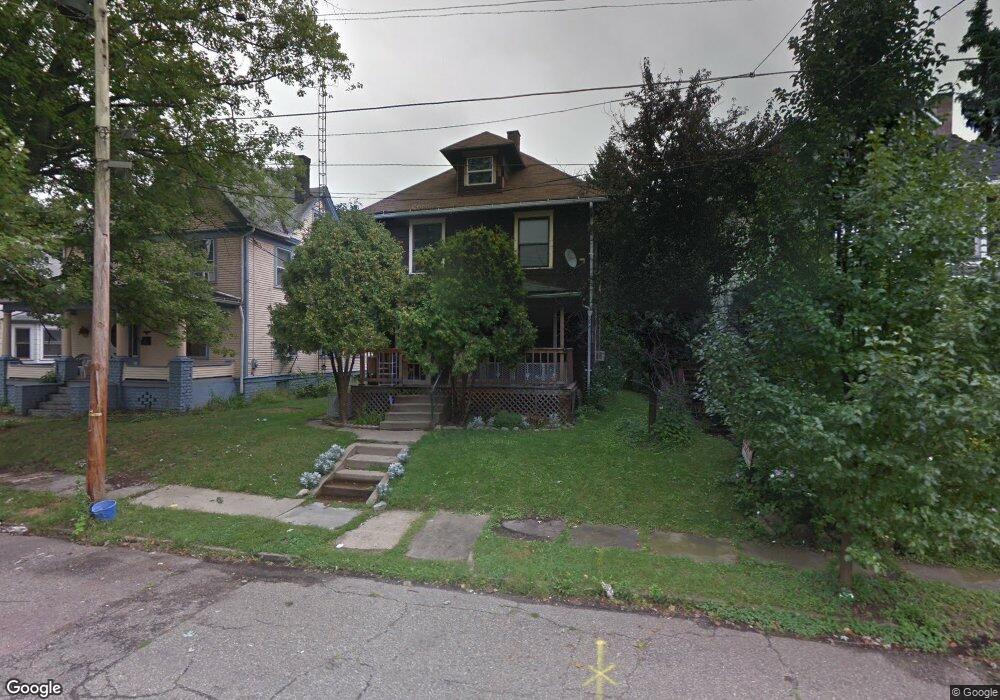
908 Harriet Ave NW Canton, OH 44703
Summit NeighborhoodEstimated Value: $11,312 - $114,000
2
Beds
2
Baths
1,440
Sq Ft
$47/Sq Ft
Est. Value
About This Home
This home is located at 908 Harriet Ave NW, Canton, OH 44703 and is currently estimated at $68,078, approximately $47 per square foot. 908 Harriet Ave NW is a home located in Stark County with nearby schools including Early Learning Center @ Schreiber, Gibbs Elementary School, and Clarendon Intermediate School.
Ownership History
Date
Name
Owned For
Owner Type
Purchase Details
Closed on
Nov 22, 2021
Sold by
R & M Baker Real Estate Investments Llc
Bought by
Joy & Carlisle Estates Llc
Current Estimated Value
Home Financials for this Owner
Home Financials are based on the most recent Mortgage that was taken out on this home.
Original Mortgage
$39,000
Interest Rate
3.09%
Mortgage Type
Construction
Purchase Details
Closed on
Jan 24, 2020
Sold by
Msa Real Estate Development Llc
Bought by
R & M Baker Real Estate Investments Llc
Purchase Details
Closed on
Mar 29, 2018
Sold by
Dowd George D
Bought by
Msa Real Estate Development Llc
Home Financials for this Owner
Home Financials are based on the most recent Mortgage that was taken out on this home.
Original Mortgage
$51,000
Interest Rate
4.38%
Mortgage Type
Commercial
Create a Home Valuation Report for This Property
The Home Valuation Report is an in-depth analysis detailing your home's value as well as a comparison with similar homes in the area
Home Values in the Area
Average Home Value in this Area
Purchase History
| Date | Buyer | Sale Price | Title Company |
|---|---|---|---|
| Joy & Carlisle Estates Llc | -- | None Listed On Document | |
| R & M Baker Real Estate Investments Llc | $12,600 | None Available | |
| Msa Real Estate Development Llc | $11,000 | Innovative Title And Escrow |
Source: Public Records
Mortgage History
| Date | Status | Borrower | Loan Amount |
|---|---|---|---|
| Closed | Joy & Carlisle Estates Llc | $39,000 | |
| Previous Owner | Msa Real Estate Development Llc | $51,000 |
Source: Public Records
Tax History Compared to Growth
Tax History
| Year | Tax Paid | Tax Assessment Tax Assessment Total Assessment is a certain percentage of the fair market value that is determined by local assessors to be the total taxable value of land and additions on the property. | Land | Improvement |
|---|---|---|---|---|
| 2025 | $1,275 | $6,240 | $2,630 | $3,610 |
| 2024 | $1,338 | $6,240 | $2,630 | $3,610 |
| 2023 | $1,303 | $5,750 | $1,580 | $4,170 |
| 2022 | $346 | $5,750 | $1,580 | $4,170 |
| 2021 | $350 | $5,750 | $1,580 | $4,170 |
| 2020 | $373 | $5,500 | $1,540 | $3,960 |
| 2019 | $321 | $5,500 | $1,540 | $3,960 |
| 2018 | $535 | $5,500 | $1,540 | $3,960 |
| 2017 | $1,198 | $5,710 | $1,680 | $4,030 |
| 2016 | $1,187 | $8,330 | $1,680 | $6,650 |
| 2015 | $577 | $8,330 | $1,680 | $6,650 |
| 2014 | $704 | $10,050 | $2,030 | $8,020 |
| 2013 | $340 | $10,050 | $2,030 | $8,020 |
Source: Public Records
Map
Nearby Homes
- 806 Troy Place NW
- 811 Troy Place NW
- 905 High Ave NW
- 916 6th St NW
- 722 High Ave NW
- 1221 9th St NW
- 1023 Fulton Rd NW
- 824 12th St NW
- 1015 4th St NW
- 413 Newton Ave NW
- 1005 Dewalt Ave NW
- 1007 Dewalt Ave NW
- 1227 Worley Ave NW
- 1024 3rd St NW
- 1231 Worley Ave NW
- 1306 12th St NW
- 1405 8th St NW
- 1409 8th St NW
- 1224 Cleveland Ave NW
- 935 Ridge Rd NW
- 900 Harriet Ave NW
- 914 Harriet Ave NW
- 925 9th St NW
- 920 Harriet Ave NW
- 903 Harriet Ave NW
- 832 Harriet Ave NW
- 907 Harriet Ave NW
- 922 Harriet Ave NW
- 911 Harriet Ave NW
- 924 9th St NW
- 915 9th St NW
- 912 Herbert Place NW
- 915 Harriet Ave NW
- 828 Harriet Ave NW
- 926 Troy Place NW
- 833 Harriet Ave NW
- 1011 9th St NW
- 919 Harriet Ave NW
- 918 Troy Place NW
- 920 Troy Place NW